Hi , In wonderware Intouch we can draw trend with respect to time.(pressure vs time, flow vs time). If I want to draw X vs Y( like pressure vs flow) trend then how is it possible ?? how can we draw x vs y curve in intouch ?
Hi , In wonderware Intouch we can draw trend with respect to time.(pressure vs time, flow vs time). If I want to draw X vs Y( like pressure vs flow) trend then how is it possible ?? how can we draw x vs y curve in intouch ?
Thanks for your support.
In all this videos in x axis there is time . But we want pressure in x axis and flow in y axis and like that. X vs Y graph we need to draw.
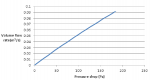
This is the application for test bed system for pump testing. We are getting flow meter reading and pressure reading from field. We want to draw a graph of pressure vs flow in intouch like the image attached below
This is the application for test bed system for pump testing. We are getting flow meter reading and pressure reading from field. We want to draw a graph of pressure vs flow in intouch like the image attached below
Otherwise you got to find the right OEM manual for that !
Getting trends with Wonderware intouch seems little bit more complex than just like the above video.
It depends of your bench instrumenatations, i noticed that they called trends by differents category like pens trends...
I have a look on the OEM manuals and it seems that there is one particuralrly interesting about trends dispaying...