G
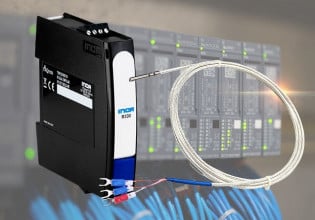
New to RSView32 and this forum. I have several wireless sensors reporting temperature to an OPC server which is then displayed within an RSView32 project. These data are for monitoring only, no control. I would like to average the most recent five tempertures and display that running average as a graph. One complication is that the sensors report on about 5-minute intervals, but not at fixed times and once in a while, a signal is blocked and a value is not reported. Therefore, I need to be able to average the last five values regardless of when they are reported or average however many values there are in a half hour or even one hour interval.
I'm not a programmer or automation engineer, but I sure can follow directions well. I already own all the hardware and software and we use RSView32 for or refrigeration control systems, so I want to stick with that for this application. It would be great if somebody had a quick answer for this, but I am also looking for someone who can provide similar support and perhaps do some programming and configuration in the future as the need arises.
I'm not a programmer or automation engineer, but I sure can follow directions well. I already own all the hardware and software and we use RSView32 for or refrigeration control systems, so I want to stick with that for this application. It would be great if somebody had a quick answer for this, but I am also looking for someone who can provide similar support and perhaps do some programming and configuration in the future as the need arises.


