A digital pressure transmitter has a calibrated input range of 0 to 75 PSI, and a 14-bit output (0 to 16383 ``count’’ range). Complete the following table of values for this transmitter, assuming perfect calibration (no error):
$$\begin{array} {|l|l|} \hline Input pressure & Percent of span & Counts & Counts \\ \hline (PSI) & ( \\ \hline \ & 0 & & \\ \hline & 36 & & \\ \hline & 62 & & \\ \hline & 89 & & \\ \hline & 95 & & \\ \hline \end{array}$$
$$\begin{array} {|l|l|} \hline Input pressure & Percent of span & Counts & Counts \\ \hline (PSI) & ( \\ \hline \0 & 0 & 0 & 000 \\ \hline 27 & 36 & 5897 or 5898 & 1709 or 170A \\ \hline 46.5 & 62 & 10157 or 10158 & 27AD or 27AE \\ \hline 66.75 & 89 & 14580 or 14581 & 38F4 or 38F5 \\ \hline 71.25 & 95 & 15563 or 15564 & 3CCB or 3CCC \\ \hline \end{array}$$
Suppose you wish to calibrate a thermocouple temperature transmitter to an input range of 0 to 1500 degrees F, with an output range of 4 to 20 mA. Complete the following calibration table showing the proper test temperatures and the ideal output signals at those levels:
$$\begin{array} {|l|l|} \hline Input temp & Percent of span & Output signal \\ \hline applied (deg F) & ( \\ \hline \ & 0 & \\ \hline & 25 & \\ \hline & 50 & \\ \hline & 75 & \\ \hline & 100 & \\ \hline \end{array}$$
$$\begin{array} {|l|l|} \hline Input temp & Percent of span & Output signal \\ \hline applied (deg F) & ( \\ \hline \ 0 & 0 & 4 \\ \hline 375 & 25 & 8 \\ \hline 750 & 50 & 12 \\ \hline 1125 & 75 & 16 \\ \hline 1500 & 100 & 20 \\ \hline \end{array}$$
{\bf This question is intended for exams only and not worksheets!}.
A temperature transmitter has a calibrated range of -80 to 150 degrees F and its output signal range is 4 to 20 mA. Complete the following table of values for this transmitter, assuming perfect calibration (no error). Be sure to show your work!
$$\begin{array} {|l|l|} \hline Measured temp & Percent of span & Output signal \\ \hline ($^{o}$F) & ( \\ \hline \120 & & \\ \hline -45 & & \\ \hline & 42 & \\ \hline & 25 & \\ \hline & & 7.5 \\ \hline & & 12.9 \\ \hline \end{array}$$
$$\begin{array} {|l|l|} \hline Measured temp & Percent of span & Output signal \\ \hline ($^{o}$F) & ( \\ \hline \120 & 86.96 & 17.91 \\ \hline -45 & 15.22 & 6.435 \\ \hline 16.6 & 42 & 10.72 \\ \hline -22.5 & 25 & 8 \\ \hline -29.69 & 21.88 & 7.5 \\ \hline 47.94 & 55.63 & 12.9 \\ \hline \end{array}$$
A Foxboro pneumatic square root extractor has a calibrated range of 3 to 15 PSI for both input and output. Complete the following table of values for this relay, assuming perfect calibration (no error). Be sure to show your work!
$$\begin{array} {|l|l|} \hline Input signal & Percent of input & Percent of output & Output signal \\ \hline (PSI) & span ( \\ \hline \5 & & & \\ \hline 13 & & & \\ \hline & 50 & & \\ \hline & 30 & & \\ \hline & & 80 & \\ \hline & & 15 & \\ \hline & & & 7 \\ \hline & & & 12 \\ \hline \end{array}$$
{\bf Partial answer:}
$$\begin{array} {|l|l|} \hline Input signal & Percent of input & Percent of output & Output signal \\ \hline (PSI) & span ( \\ \hline \5 & & & \\ \hline 13 & 83.33 & 91.29 & 13.95 \\ \hline & 50 & & \\ \hline & 30 & & \\ \hline & & 80 & \\ \hline 3.27 & 2.25 & 15 & 4.8 \\ \hline & & & 7 \\ \hline & & & 12 \\ \hline \end{array}$$
$$\begin{array} {|l|l|} \hline Input signal & Percent of input & Percent of output & Output signal \\ \hline (PSI) & span ( \\ \hline \5 & 16.67 & 40.82 & 7.899 \\ \hline 13 & 83.33 & 91.29 & 13.95 \\ \hline 9 & 50 & 70.71 & 11.49 \\ \hline 6.6 & 30 & 54.77 & 9.573 \\ \hline 10.68 & 64 & 80 & 12.6 \\ \hline 3.27 & 2.25 & 15 & 4.8 \\ \hline 4.333 & 11.11 & 33.33 & 7 \\ \hline 9.75 & 56.25 & 75 & 12 \\ \hline \end{array}$$
Every instrument has at least one input and at least one output. For instruments responding linearly, the correspondence between input and output is proportional:
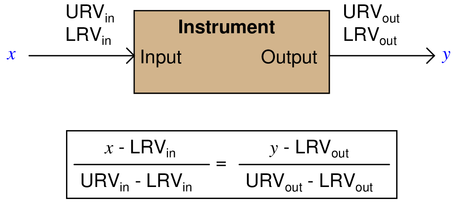
A practical example of this is a pressure transmitter, in this case one with an input range of 0 to 1023 PSI and an output of 4-20 mA:
If you happened to measure an output current of 14.7 mA from this pressure transmitter, it would be a simple matter for you to calculate the corresponding input pressure to be 684.13 PSI.
However, students are often taken by surprise when they encounter an analog-to-digital converter (ADC) or digital-to-analog converter (DAC) and are asked to correlate input and output for such devices. What might seem a daunting task at first, though, soon reveals itself to be the same input-to-output correspondence calculations they’ve seen all along in the guise of analog sensors and other instruments.
Take for example this analog-to-digital converter, with a 10-bit output (a ``count’’ range of 0 to 1023) and a 4-20 mA input:
Calculate the corresponding ``count’’ output of this ADC circuit given a 6.82 mA input signal.
Count = 180 (rounding low) or 181 (rounding high)
First, converting the given 6.82 mA input value into a per-unit figure:
$${6.82 \hbox{ mA} - 4 \hbox{ mA} \over 20 \hbox{ mA} - 4 \hbox{ mA}} = 0.17625 \hbox{ per unit}$$
We know that this is a 10-bit converter, therefore its count range (expressed in decimal) must be 0 to 1023 counts. Thus, we may multiply the 0.17625 per-unit figure by the maximum count value of 1023 to see how many counts this ADC will output at 6.82 mA:
$$(0.17625)(1023 \hbox{ counts}) = 180.30375 \hbox{ counts}$$
Since we don’t know anything about how this particular ADC digitizes the signal, we cannot predict whether the output will be rounded up, rounded down, or perhaps even ``bobble’’ between the upper and lower rounded values:
Output ``count’’ value = 180 or 181
The ADC0804 is an example of an integrated circuit analog-to-digital converter (ADC), converting an analog input voltage signal into an 8-bit binary output:
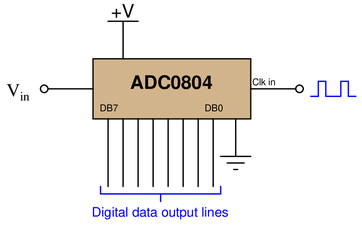
When operated from a 5.0 volt DC power supply in its simplest mode, the ADC0804 converts any DC input voltage between 0.0 volts and 5.0 volts into an 8-bit number at the command of a clock pulse. A 0.0 volt input yields a binary output (or ``count’‘) of {\tt 00000000}, of course, while a 5.0 volt input yields a count of {\tt 11111111}.
Complete this table of numbers, relating various DC input voltages with count values (expressed in binary, hex, and decimal) for an ADC0804 having an input range of 0.0 to 5.0 volts DC:
$$\begin{array} {|l|l|} \hline DC input voltage & Binary count & Hex count & Decimal count \\ \hline 0.0 volts & 00000000 & & \\ \hline & 00110011 & & 51 \\ \hline 2.2 volts & & 70 & \\ \hline & & B3 & 179 \\ \hline & 11001100 & CC & \\ \hline 5.0 volts & 11111111 & & \\ \hline \end{array}$$
{\bf Partial answer:}
$$\begin{array} {|l|l|} \hline DC input voltage & Binary count & Hex count & Decimal count \\ \hline 0.0 volts & 00000000 & & \\ \hline 1.0 volts & 00110011 & & 51 \\ \hline 2.2 volts & 01110000 & 70 & 112 \\ \hline 3.51 volts & 10110011 & B3 & 179 \\ \hline 4.0 volts & 11001100 & CC & 204 \\ \hline 5.0 volts & 11111111 & FF & \\ \hline \end{array}$$
The input voltage range of this ADC is 0.0 to 5.0 volts DC, and the output ``count’’ range is 0 to 255 (because it outputs an 8-bit unsigned binary number which has this counting range). Therefore, the relationship between the input voltage and the output count value (in decimal) is a simple proportionality:
$${V_{in} \over 5} = {\hbox{Count} \over 255}$$
Note that all count values are shown rounded {\it down} to the nearest integer value:
$$\begin{array} {|l|l|} \hline DC input voltage & Binary count & Hex count & Decimal count \\ \hline 0.0 volts & 00000000 & 00 & 0 \\ \hline 1.0 volts & 00110011 & 33 & 51 \\ \hline 2.2 volts & 01110000 & 70 & 112 \\ \hline 3.51 volts & 10110011 & B3 & 179 \\ \hline 4.0 volts & 11001100 & CC & 204 \\ \hline 5.0 volts & 11111111 & FF & 255 \\ \hline \end{array}$$
An analog-to-digital converter has a 12-bit binary output and an analog input voltage range of 0.0 to + 5.0 volts. Calculate:
{\bullet} The digital output (in hexadecimal) at 0.0 volts analog input =
{\bullet} The digital output (in hexadecimal) at 5.0 volts analog input =
{\bullet} The digital output (in hexadecimal) at 2.1 volts analog input =
{\bullet} The analog input corresponding to a digital output of {\tt 2D0} =
{\bullet} The analog input corresponding to a digital output of {\tt F14} =
An analog-to-digital converter has a 16-bit binary output and an analog input voltage range of 0.0 to + 10.0 volts. Calculate:
{\bullet} The digital output (in hexadecimal) at 0.0 volts analog input =
{\bullet} The digital output (in hexadecimal) at 10.0 volts analog input =
{\bullet} The digital output (in hexadecimal) at 3.4 volts analog input =
{\bullet} The analog input corresponding to a digital output of {\tt 3D6A} =
{\bullet} The analog input corresponding to a digital output of {\tt C005} =
An analog-to-digital converter (ADC) has a calibrated input range of 0 to 10 volts, and a 12-bit output (0 to 4095 ``count’’ range). Complete the following table of values for this converter, assuming perfect calibration (no error):
$$\begin{array} {|l|l|} \hline Input voltage & Percent of span & Counts & Counts \\ \hline (volts) & ( \\ \hline \ & 0 & & \\ \hline & 25 & & \\ \hline & 50 & & \\ \hline & 75 & & \\ \hline & 100 & & \\ \hline \end{array}$$
$$\begin{array} {|l|l|} \hline Input voltage & Percent of span & Counts & Counts \\ \hline (volts) & ( \\ \hline \0 & 0 & 0 & 000 \\ \hline 2.5 & 25 & 1023 or 1024 & 3FF or 400 \\ \hline 5.0 & 50 & 2047 or 2048 & 7FF or 800 \\ \hline 7.5 & 75 & 3071 or 3072 & BFF or C00 \\ \hline 10 & 100 & 4095 & FFF \\ \hline \end{array}$$
An essential component of any digital control system is an {\it analog-to-digital converter}, or {\it ADC}. This is necessary to convert the analog process variable measurement into a digital number for the control algorithm to process. Another essential component is a {\it digital-to-analog converter}, or {\it DAC}, which does the exact opposite.
In a system using 4-20 mA analog currents to relay instrument signals, there is an ADC located at the process variable input of the controller, and a DAC located at the output of the controller:

In digital ``Fieldbus’’ systems, the communication is all digital, which places the ADC at the transmitter and the DAC at the transducer:
In either case, we need to ``scale’’ the binary count of the ADC and DAC to their respective analog variable values. Consider a flow control system, with a flow transmitter ranged from 0 to 200 GPM and a pneumatic control valve operating on a pressure range of 3 to 15 PSI (instrument air). Assuming the ADC has a resolution of 16 bits (a digital conversion range of \$0000 to \$FFFF) and the DAC has a resolution of 14 bits (a digital conversion range of \$0000 to \$3FFF), determine the digital values corresponding to a 50
{\bf Calibration table for process variable signal (ADC)}
$$\begin{array} {|l|l|} \hline Measurement & Digital output \\ \hline 0 GPM & \$0000 \\ \hline 100 GPM & \\ \hline 200 GPM & \$FFFF \\ \hline \end{array}$$
{\bf Calibration table for process variable signal (ADC)}
$$\begin{array} {|l|l|} \hline Measurement & Digital output \\ \hline 0 GPM & \$0000 \\ \hline 100 GPM & \$8000 \\ \hline 200 GPM & \$FFFF \\ \hline \end{array}$$
100 GPM = 50
9 PSI = 60
An analog-to-digital converter (ADC) has a calibrated input range of 0 to 10 volts, and a 16-bit output (0 to 65535 ``count’’ range). Complete the following table of values for this converter, assuming perfect calibration (no error):
$$\begin{array} {|l|l|} \hline Input voltage & Percent of span & Counts & Counts \\ \hline (volts) & ( \\ \hline \ & 0 & & \\ \hline & 25 & & \\ \hline & 50 & & \\ \hline & 75 & & \\ \hline & 100 & & \\ \hline \end{array}$$
$$\begin{array} {|l|l|} \hline Input voltage & Percent of span & Counts & Counts \\ \hline (volts) & ( \\ \hline \0 & 0 & 0 & 0000 \\ \hline 2.5 & 25 & 16383 or 16384 & 3FFF or 4000 \\ \hline 5.0 & 50 & 32767 or 32768 & 7FFF or 8000 \\ \hline 7.5 & 75 & 49151 or 49152 & BFFF or C000 \\ \hline 10 & 100 & 65535 & FFFF \\ \hline \end{array}$$
Suppose you wish to calibrate an RTD temperature transmitter to an input range of 50 to 200 degrees F, with an output range of 4 to 20 mA. Complete the following calibration table showing the proper test temperatures and the ideal output signals at those levels:
$$\begin{array} {|l|l|} \hline Input temp & Percent of span & Output signal \\ \hline applied (deg F) & ( \\ \hline \ & 0 & \\ \hline & 25 & \\ \hline & 50 & \\ \hline & 75 & \\ \hline & 100 & \\ \hline \end{array}$$
$$\begin{array} {|l|l|} \hline Input temp & Percent of span & Output signal \\ \hline applied (deg F) & ( \\ \hline \ 50 & 0 & 4 \\ \hline 87.5 & 25 & 8 \\ \hline 125 & 50 & 12 \\ \hline 162.5 & 75 & 16 \\ \hline 200 & 100 & 20 \\ \hline \end{array}$$
{\bf This question is intended for exams only and not worksheets!}.
A digital pressure transmitter has a calibrated input range of 50 to 200 PSI, and a 10-bit output (0 to 1023 ``count’’ range). Complete the following table of values for this transmitter, assuming perfect calibration (no error):
$$\begin{array} {|l|l|} \hline Input pressure & Percent of span & Counts & Counts \\ \hline (PSI) & ( \\ \hline \ & 7 & & \\ \hline & 22 & & \\ \hline & 39 & & \\ \hline & 56 & & \\ \hline & 78 & & \\ \hline \end{array}$$
This is a graded question—no answers or hints given!
$$\begin{array} {|l|l|} \hline Input pressure & Percent of span & Counts & Counts \\ \hline (PSI) & ( \\ \hline \60.5 & 7 & 71 or 72 & 047 or 048 \\ \hline 83 & 22 & 225 or 226 & 0E1 or 0E2 \\ \hline 108.5 & 39 & 398 or 399 & 18E or 18F \\ \hline 134 & 56 & 572 or 573 & 23C or 23D \\ \hline 167 & 78 & 797 or 798 & 31D or 31E \\ \hline \end{array}$$
A digital level transmitter has a calibrated input range of 20 to 170 inches of liquid level, and a 10-bit output (0 to 1023 ``count’’ range). Complete the following table of values for this transmitter, assuming perfect calibration (no error):
$$\begin{array} {|l|l|} \hline Input level & Percent of span & Counts & Counts \\ \hline (inches) & ( \\ \hline \ & 11 & & \\ \hline & 28 & & \\ \hline & 55 & & \\ \hline & 73 & & \\ \hline & 92 & & \\ \hline \end{array}$$
$$\begin{array} {|l|l|} \hline Input level & Percent of span & Counts & Counts \\ \hline (inches) & ( \\ \hline \36.5 & 11 & 112 or 113 & 070 or 071 \\ \hline 62.0 & 28 & 286 or 287 & 11E or 11F \\ \hline 102.5 & 55 & 562 or 563 & 232 or 233 \\ \hline 129.5 & 73 & 746 or 747 & 2EA or 2EB \\ \hline 158.0 & 92 & 941 or 942 & 3AD or 3AE \\ \hline \end{array}$$
An analog-to-digital converter (ADC) has a calibrated input range of 0 to 5 volts, and a 12-bit output. Complete the following table of values for this converter, assuming perfect calibration (no error):
$$\begin{array} {|l|l|} \hline Input voltage & Percent of span & Counts & Counts \\ \hline (volts) & ( \\ \hline \1.6 & & & \\ \hline & & 3022 & \\ \hline & 40 & & \\ \hline & & & A2F \\ \hline \end{array}$$
{\bf Partial answer:}
$$\begin{array} {|l|l|} \hline Input voltage & Percent of span & Counts & Counts \\ \hline (volts) & ( \\ \hline \1.6 & 32 & 1310 or 1311 & \\ \hline & 73.8 & 3022 & \\ \hline & 40 & & 666 \\ \hline 3.18 & & & A2F \\ \hline \end{array}$$
That fact that this is a 12-bit ADC tells us all we need to know to calculate its maximum count value:
$$\hbox{Count}_{max} = 2^{12} - 1 = 4096 - 1 = 4095$$
Therefore, the count range is 0 to 4095 counts, matching the input voltage range of 0 to 5 volts, proportional. Relating input voltage to count value is as simple as solving for this proportionality. Each count is worth ${1 \over 4095}$ of 5 volts, or 1.221 mV.
Performing calculations for the first table row, we take the given input voltage of 1.6 volts and solve for the percentage of range as well as the proportional count value:
$${1.6 \hbox{ V} \over 5 \hbox{ V}} = 32
$$N = 1310.4 \hbox{ counts}$$
Since there is no such thing as a non-integer count value, we may either round up (to 1311 counts) or round down (to 1310 counts). The last step is simply converting the decimal values of 1310 and 1311 into hexadecimal.
$$\begin{array} {|l|l|} \hline Input voltage & Percent of span & Counts & Counts \\ \hline (volts) & ( \\ \hline \1.6 & 32 & 1310 or 1311 & 51E or 51F \\ \hline 3.69 & 73.8 & 3022 & BCE \\ \hline 2.0 & 40 & 1638 & 666 \\ \hline 3.18 & 63.7 & 2607 & A2F \\ \hline \end{array}$$
Suppose a FOUNDATION Fieldbus pressure transmitter is connected to measure the pressure of natural gas inside a pipeline. The expected range of pressure inside this vessel is 0 to 600 PSI.
Determine the proper configuration parameters for this Fieldbus instrument’s Analog Input (AI) block:
$$\begin{array} {|l|l|} \hline {\tt L\_Type} & 50pt \\ \hline {\tt XD\_Scale} & 50pt \\ \hline {\tt OUT\_Scale} & 50pt \\ \hline \end{array}$$
$$\begin{array} {|l|l|} \hline {\tt L\_Type} & Direct \\ \hline {\tt XD\_Scale} & 0 to 600 PSI \\ \hline {\tt OUT\_Scale} & 0 to 600 PSI \\ \hline \end{array}$$
Suppose a FOUNDATION Fieldbus differential pressure transmitter is connected to measure the pressure drop created by an orifice plate, proportional to the square of fluid flow rate through the orifice. At a flow rate of 400 GPM, the orifice produces a pressure differential of 135 inches water column.
Determine the proper configuration parameters for this Fieldbus instrument’s Analog Input (AI) block:
$$\begin{array} {|l|l|} \hline {\tt L\_Type} & 50pt \\ \hline {\tt XD\_Scale} & 50pt \\ \hline {\tt OUT\_Scale} & 50pt \\ \hline \end{array}$$
$$\begin{array} {|l|l|} \hline {\tt L\_Type} & Indirect Square Root \\ \hline {\tt XD\_Scale} & 0 to 135 inches WC \\ \hline {\tt OUT\_Scale} & 0 to 400 GPM \\ \hline \end{array}$$
Suppose a FOUNDATION Fieldbus pressure transmitter is connected to the hydraulic line supplying fluid pressure to a ram, for the purpose of measuring the ram’s exerted force based on sensed pressure. Recall that the relationship between force and fluid pressure for a piston is $F = PA$, where $F$ is force in pounds, $A$ is surface area of the piston in square inches, and $P$ is fluid pressure in PSI. Recall as well that the area for a circular object is given by the formula $A = \pi r^2$.
Supposing the ram’s piston has a diameter of exactly 2 inches, determine the proper configuration parameters for this Fieldbus instrument’s Analog Input (AI) block, assuming we wish this transmitter to report ram force over a range of 0 to 4700 pounds.
$$\begin{array} {|l|l|} \hline {\tt L\_Type} & 50pt \\ \hline {\tt XD\_Scale} & 50pt \\ \hline {\tt OUT\_Scale} & 50pt \\ \hline \end{array}$$
$$\begin{array} {|l|l|} \hline {\tt L\_Type} & Indirect \\ \hline {\tt XD\_Scale} & 0 to 1496.1 PSI \\ \hline {\tt OUT\_Scale} & 0 to 4700 pounds \\ \hline \end{array}$$
Suppose a FOUNDATION Fieldbus pressure transmitter is connected to the bottom of a vessel containing a liquid half as dense as water, for the purpose of measuring liquid height inside the vessel based on hydrostatic pressure. For every foot of liquid height, 6 inches water column pressure is sensed by the transmitter.
Determine the proper configuration parameters for this Fieldbus instrument’s Analog Input (AI) block, assuming we wish this transmitter to report liquid height over a range of 0 to 18 feet:
$$\begin{array} {|l|l|} \hline {\tt L\_Type} & 50pt \\ \hline {\tt XD\_Scale} & 50pt \\ \hline {\tt OUT\_Scale} & 50pt \\ \hline \end{array}$$
$$\begin{array} {|l|l|} \hline {\tt L\_Type} & Indirect \\ \hline {\tt XD\_Scale} & 0 to 108 inches WC \\ \hline {\tt OUT\_Scale} & 0 to 18 feet \\ \hline \end{array}$$
Suppose a FOUNDATION Fieldbus pressure transmitter is connected to the bottom of a water storage tank, for the purpose of measuring water volume stored inside the tank based on hydrostatic pressure. The tank is shaped like a vertical cylinder, 10 feet in diameter and 20 feet high.
Determine the proper configuration parameters for this Fieldbus instrument’s Analog Input (AI) block, assuming we wish this transmitter to report liquid height over a range of 0 to 15 feet, expressed in units of cubic feet:
$$\begin{array} {|l|l|} \hline {\tt L\_Type} & 50pt \\ \hline {\tt XD\_Scale} & 50pt \\ \hline {\tt OUT\_Scale} & 50pt \\ \hline \end{array}$$
$$\begin{array} {|l|l|} \hline {\tt L\_Type} & Indirect \\ \hline {\tt XD\_Scale} & 0 to 180 inches WC \\ \hline {\tt OUT\_Scale} & 0 to 1178.1 cubic feet \\ \hline \end{array}$$
Suppose a FOUNDATION Fieldbus pressure transmitter is connected to the bottom of a liquid storage vessel for the purpose of measuring liquid height based on hydrostatic pressure. This transmitter happens to be configured with the following Analog Input (AI) block parameters:
$$\begin{array} {|l|l|} \hline {\tt L\_Type} & Indirect \\ \hline {\tt XD\_Scale} & 38 to 183.488 inches WC \\ \hline {\tt OUT\_Scale} & 0 to 14 feet \\ \hline \end{array}$$
Calculate the height reported by this transmitter when it senses a hydrostatic pressure of 71.8 inches WC. {\bf Height = 3.2525 feet}
Calculate the hydrostatic pressure sensed by this transmitter when it reports a liquid height of 9.3 feet. {\bf Pressure = 134.65 inches WC}
Suppose you wish to calibrate a pneumatic pressure transmitter to an input range of -10 to +50 inches of mercury, with an output range of 3 to 15 PSI. Complete the following calibration table showing the test pressures to use and the allowable low/high output signals for a calibrated tolerance of +/- 0.5
$$\begin{array} {|l|l|} \hline Input pressure & Percent of span & Output signal & Output signal & Output signal \\ \hline applied (” Hg) & ( \\ \hline \ & 0 & & & \\ \hline & 25 & & & \\ \hline & 50 & & & \\ \hline & 75 & & & \\ \hline & 100 & & & \\ \hline \end{array}$$
$$\begin{array} {|l|l|} \hline Input pressure & Percent of span & Output signal & Output signal & Output signal \\ \hline applied (” Hg) & ( \\ \hline \10 L & 0 & 3 & 2.94 & 3.06 \\ \hline 5 H & 25 & 6 & 5.94 & 6.06 \\ \hline 20 H & 50 & 9 & 8.94 & 9.06 \\ \hline 35 H & 75 & 12 & 11.94 & 12.06 \\ \hline 50 H & 100 & 15 & 14.94 & 15.06 \\ \hline \end{array}$$
A tachogenerator is used to measure the rotary speed of a machine. Its calibrated range is 0 to 1500 RPM (revolutions per minute) and its corresponding signal output is 0 to 10 volts DC. Given these range values, calculate the output voltages for the following input shaft speeds, and then describe how you were able to correlate the different speeds to output voltage values:
$$\begin{array} {|l|l|} \hline Shaft speed & Output voltage \\ \hline (RPM) & (volts DC) \\ \hline 100 & \\ \hline 350 & \\ \hline 500 & \\ \hline 750 & \\ \hline 890 & \\ \hline 975 & \\ \hline 1230 & \\ \hline 1410 & \\ \hline 1500 & \\ \hline \\ \hline \end{array}$$
$$\begin{array} {|l|l|} \hline Shaft speed & Output voltage \\ \hline (RPM) & (volts DC) \\ \hline 100 & 0.67 \\ \hline 350 & 2.3 \\ \hline 500 & 3.3 \\ \hline 750 & 5.0 \\ \hline 890 & 5.9 \\ \hline 975 & 6.5 \\ \hline 1230 & 8.2 \\ \hline 1410 & 9.4 \\ \hline 1500 & 10.00 \\ \hline \end{array}$$
This sort of problem may be solved using simple proportions. We know that the voltage output by a tachogenerator will be directly proportional to shaft speed. In other words, doubling the shaft speed doubles the voltage. This makes the math very simple.
All we have to do is determine what percentage of full speed (1500 RPM) our given speed is, and then multiply the full-speed voltage (10 volts) by that percentage.
We may express the relationship between shaft speed ($S$) and voltage ($V$) as a proportionality:
$$S \propto V$$
We may express this relationship a little more precisely by inserting a {\it constant of proportionality} ($k$) and changing the proportional symbol to an equality:
$$S = kV$$
Now, all we need to do is solve for $k$ using a pair of simultaneous values for $S$ and $V$. Since we were told the output of the tachogenerator is 10 volts at 1500 RPM:
$$1500 = k 10$$
$$k = 150$$
Knowing that $k$ = 150 for this tachogenerator (with $S$ in units of RPM and $V$ in units of volts) allows us to solve for any speed given any voltage by way of simple multiplication:
$$S = 150 V$$
If the tachogenerator drives a voltmeter, we could even post this $k$ value on the face of the meter so that an operator could multiply the voltage measurement by 150 to obtain shaft speed in RPM.
Another way to think about this sort of problem is to use a technique I call ``unity fractions.’’ Since we know tachogenerator speed and voltage to be proportional to one another, and we know they share the same zero point (0 RPM = 0 volts), we may form a fraction out of the equality 1500 RPM = 10 volts and use it in such a way as to cancel the unit of RPM and replace it with volts.
We know that any fraction where the numerator and denominator are the same quantity ($5 \over 5$ for example) has a value of 1, or unity. We also know that multiplying any value by 1 does not change that value (for example, $570 \times 1 = 570$). So, if we form a fraction out of two {\it physically equal} quantities—in this case, the fraction 10 volts divided by 1500 RPM, since those two quantities are physically equal to one another in the context of the tachogenerator—this ``unity fraction’’ has a {\it physical} value of 1, and we may safely multiply it by any other value without changing that other value’s quantity. The point of doing this is to cancel out the unwanted unit and replace it with another unit.
To see how this works, let’s use this technique to calculate tachogenerator voltage at 1230 RPM:
$$\left({1230 \hbox{ RPM} \over 1} \right) \left( {10 \hbox{ volts} \over 1500 \hbox{ RPM}} \right) = 8.2 \hbox{ volts}$$
The unit of ``RPM’’ cancels from the top of the left-hand fraction and the bottom of the right-hand fraction, leaving the unit of ``volts’’ as the only one remaining. Since the unity fraction of $10 \hbox{ volts} \over 1500 \hbox{ RPM}$ has a physical value of 1, multiplying it by the fraction $1230 \hbox{ RPM} \over 1$ does not alter that value. We only cancel out the unit of RPM, to tell us how many volts the tachogenerator will output at that speed.
We can use this same ``unity fraction’’ to translate from volts to RPM, too! Imagine a situation where the tachogenerator was spinning fast enough to output a voltage of 7.1 volts. How fast is this? We can use this same unit-cancellation technique to find out:
$$\left({7.1 \hbox{ volts} \over 1} \right) \left( 1500 \hbox{ RPM} \over {10 \hbox{ volts}} \right) = 1065 \hbox{ RPM}$$
Since the unity fraction of $10 \hbox{ volts} \over 1500 \hbox{ RPM}$ has a physical value of 1, we may flip it upside-down without changing its value ($5 \over 5$ is still 1, whether you flip the fraction upside-down or not!). In this case, we needed to flip the unity fraction upside-down in order to make the unit of ``volts’’ cancel out and leave us with the unit of ``RPM’’ as the only one left standing.
While the technique of ``unity fractions’’ may seem over-complicated, especially for a simple proportion problem like this one, it is very powerful. We will find lots of application for this technique later on in our studies!
Suppose you wish to calibrate an electronic pressure transmitter to an input range of 0 to 50 PSI, with an output range of 4 to 20 mA. Complete the following calibration table showing the proper test pressures and the ideal output signal levels at those pressures:
$$\begin{array} {|l|l|} \hline Input pressure & Percent of span & Output signal \\ \hline applied (PSI) & ( \\ \hline \ & 0 & \\ \hline & 25 & \\ \hline & 50 & \\ \hline & 75 & \\ \hline & 100 & \\ \hline \end{array}$$
$$\begin{array} {|l|l|} \hline Input pressure & Percent of span & Output signal \\ \hline applied (PSI) & ( \\ \hline \ 0 & 0 & 4 \\ \hline 12.5 & 25 & 8 \\ \hline 25 & 50 & 12 \\ \hline 37.5 & 75 & 16 \\ \hline 50 & 100 & 20 \\ \hline \end{array}$$
{\bf This question is intended for exams only and not worksheets!}.
Suppose you wish to calibrate an electronic pressure transmitter to an input range of 0 to 200 PSI, with an output range of 4 to 20 mA. Complete the following calibration table showing the proper test pressures and the ideal output signal levels at those pressures:
$$\begin{array} {|l|l|} \hline Input pressure & Percent of span & Output signal \\ \hline applied (PSI) & ( \\ \hline \ & 0 & \\ \hline & 25 & \\ \hline & 50 & \\ \hline & 75 & \\ \hline & 100 & \\ \hline \end{array}$$
$$\begin{array} {|l|l|} \hline Input pressure & Percent of span & Output signal \\ \hline applied (PSI) & ( \\ \hline \ 0 & 0 & 4 \\ \hline 50 & 25 & 8 \\ \hline 100 & 50 & 12 \\ \hline 150 & 75 & 16 \\ \hline 200 & 100 & 20 \\ \hline \end{array}$$
{\bf This question is intended for exams only and not worksheets!}.
In instrumentation parlance, a {\it transducer} is a calibrated device used to convert one standardized signal into another standardized signal. One very common form of transducer is an {\it I/P transducer}, which converts an electric current signal into a pneumatic pressure signal:

The symbols shown above are standard for process and instrumentation diagrams (P\&ID’s), where an electric cable is shown as a dashed line, a pneumatic pipe or tube shown as a line with double hash-marks periodically drawn through it, and the instrument is a circle with letters (in this case, ``Y’‘, representing a signal relay, computing element, transducer, or converter).
The most popular range for electric current signals is 4 to 20 mA DC. The most common range for pneumatic (air pressure) signals is 3 to 15 PSI. Therefore, the most common type of I/P transducer has an input range of 4-20 mA and an output range of 3-15 PSI. Both of these ranges are there to represent some measured or manipulated quantity in an instrument system. That is, 0
Complete all the missing data in the following calibration table for this I/P transducer, and then describe how you were able to correlate the different percentages of range with specific current and pressure signal values:
$$\begin{array} {|l|l|} \hline Input current & Percent of range & Output pressure \\ \hline (mA) & ( \\ \hline \4 & 0 & 3 \\ \hline & 10 & \\ \hline & 20 & \\ \hline & 25 & \\ \hline & 30 & \\ \hline & 40 & \\ \hline 12 & 50 & 9 \\ \hline & 60 & \\ \hline & 70 & \\ \hline & 75 & \\ \hline & 80 & \\ \hline & 90 & \\ \hline 20 & 100 & 15 \\ \hline \end{array}$$
$$\begin{array} {|l|l|} \hline Input current & Percent of range & Output pressure \\ \hline (mA) & ( \\ \hline \4 & 0 & 3 \\ \hline 5.6 & 10 & 4.2 \\ \hline 7.2 & 20 & 5.4 \\ \hline 8 & 25 & 6 \\ \hline 8.8 & 30 & 6.6 \\ \hline 10.4 & 40 & 7.8 \\ \hline 12 & 50 & 9 \\ \hline 13.6 & 60 & 10.2 \\ \hline 15.2 & 70 & 11.4 \\ \hline 16 & 75 & 12 \\ \hline 16.8 & 80 & 12.6 \\ \hline 18.4 & 90 & 13.8 \\ \hline 20 & 100 & 15 \\ \hline \end{array}$$
Here are the equations I used to arrive at my answers:
$$\hbox{current} = (16 \hbox{ mA}) \left( {
$$\hbox{pressure} = (12 \hbox{ PSI}) \left( {
In general, to go from a percentage value to either current or pressure, take that percentage (as a decimal value between 0 and 1 inclusive) and multiply it by the {\it span} of the signal range, then add the live zero offset.
Going from either a current value or a pressure value to a percentage is little more than the reverse of the above procedure. Watch how I convert a current value of 16.8 milliamps into a percentage of range:
$$16.8 \hbox{ mA} - 4.0 \hbox{ mA} = 12.8 \hbox{ mA} 50pt \hbox{\it First, subtract the live-zero offset}$$
$${12.8 \hbox{ mA} \over 16.0 \hbox{ mA}} = 0.8 50pt \hbox{\it Second, divide that number by the span}$$
$$0.8 \times 100
These sorts of calculations are done quite often by instrument technicians as they troubleshoot instrument systems. Imagine troubleshooting a 4-20 mA instrument circuit using an ammeter to measure current. How do you correlate the measured current value into a percentage of range, and from that into an equivalent process measurement? These calculations allow you to do this, which gives you a way to translate the current signals you measure with your meter into equivalent process values, without having to look at a pre-calibrated indicator.
Suppose you wish to calibrate a current-to-pressure (``I/P’‘) transducer to an output range of 3 to 15 PSI, with an input range of 4 to 20 mA. Complete the following calibration table showing the proper test pressures and the ideal input signal levels at those pressures:
$$\begin{array} {|l|l|} \hline Input signal & Percent of span & Output pressure \\ \hline applied (mA) & ( \\ \hline \ & 35 & \\ \hline & 80 & \\ \hline & 95 & \\ \hline \end{array}$$
$$\begin{array} {|l|l|} \hline Input signal & Percent of span & Output pressure \\ \hline applied (mA) & ( \\ \hline \ 9.6 & 35 & 7.2 \\ \hline 16.8 & 80 & 12.6 \\ \hline 19.2 & 95 & 14.4 \\ \hline \end{array}$$
An electronic level transmitter has a calibrated range of 0 to 2 feet, and its output signal range is 4 to 20 mA. Complete the following table of values for this transmitter, assuming perfect calibration (no error). Be sure to show your work!
$$\begin{array} {|l|l|} \hline Measured level & Percent of span & Output signal \\ \hline (feet) & ( \\ \hline \1.6 & & \\ \hline & & 7.1 \\ \hline & 40 & \\ \hline \end{array}$$
$$\begin{array} {|l|l|} \hline Measured level & Percent of span & Output signal \\ \hline (feet) & ( \\ \hline \1.6 & 80 & 16.8 \\ \hline 0.3875 & 19.375 & 7.1 \\ \hline 0.8 & 40 & 10.4 \\ \hline \end{array}$$
A pneumatic level transmitter has a calibrated range of 0 to 5 feet, and its output signal range is 3 to 15 PSI. Complete the following table of values for this transmitter, assuming perfect calibration (no error). Be sure to show your work!
$$\begin{array} {|l|l|} \hline Measured level & Percent of span & Output signal \\ \hline (feet) & ( \\ \hline \3.2 & & \\ \hline & & 4 \\ \hline & 50 & \\ \hline 2.4 & & \\ \hline & & 11.3 \\ \hline & 18 & \\ \hline \end{array}$$
$$\begin{array} {|l|l|} \hline Measured level & Percent of span & Output signal \\ \hline (feet) & ( \\ \hline \3.2 & 64 & 10.68 \\ \hline 0.4167 & 8.333 & 4 \\ \hline 2.5 & 50 & 9 \\ \hline 2.4 & 48 & 8.76 \\ \hline 3.458 & 69.17 & 11.3 \\ \hline 0.9 & 18 & 5.16 \\ \hline \end{array}$$
Suppose you wish to calibrate an electronic pressure transmitter to an input range of 0 to 50 inches of water, with an output range of 4 to 20 mA. Complete the following calibration table showing the proper test pressures and the ideal output signal levels at those pressures:
$$\begin{array} {|l|l|} \hline Input pressure & Percent of span & Output signal \\ \hline applied (” W.C.) & ( \\ \hline \ & 5 & \\ \hline & 33 & \\ \hline & 61 & \\ \hline \end{array}$$
$$\begin{array} {|l|l|} \hline Input pressure & Percent of span & Output signal \\ \hline applied (” W.C.) & ( \\ \hline \ 2.5 & 5 & 4.8 \\ \hline 16.5 & 33 & 9.28 \\ \hline 30.5 & 61 & 13.76 \\ \hline \end{array}$$
{\bf This question is intended for exams only and not worksheets!}.
An electronic pressure transmitter has a calibrated range of 0 to 200 inches of mercury, and its output signal range is 4 to 20 mA. Complete the following table of values for this transmitter, assuming perfect calibration (no error):
$$\begin{array} {|l|l|} \hline Input pressure & Percent of span & Output signal \\ \hline applied (” Hg) & ( \\ \hline \24 & & \\ \hline & 19 & \\ \hline & & 11.7 \\ \hline \end{array}$$
$$\begin{array} {|l|l|} \hline Input pressure & Percent of span & Output signal \\ \hline applied (” Hg) & ( \\ \hline \24 & 12 & 5.92 \\ \hline 38 & 19 & 7.04 \\ \hline 96.25 & 48.13 & 11.7 \\ \hline \end{array}$$
{\bf This question is intended for exams only and not worksheets!}.
Suppose you had a current-to-pressure (``I/P’‘) transducer with an output range of 3 to 15 PSI and an input range of 4 to 20 mA. The following calibration table shows several input signal levels and their corresponding percentages of span and output pressures:
$$\begin{array} {|l|l|} \hline Input signal & Percent of span & Output pressure \\ \hline applied (mA) & ( \\ \hline \6.88 & 18 & 5.16 \\ \hline 5.1 & 6.88 & 3.83 \\ \hline 12.8 & 55 & 9.6 \\ \hline 17.44 & 84 & 13.08 \\ \hline 6.53 & 15.83 & 4.9 \\ \hline \end{array}$$
Here are two possible formulae for entry into cell R2C5:
{\tt = ((R2C1 - 4) / 16) * 12 + 3}
{\tt = R2C3 * 12 + 3}
One very practical use for this type of spreadsheet program is to create practice problems for yourself, so that you may practice instrument input/output range calculations.
{\bf Summary Quiz:}
Calculate the output pressure (3-15 PSI range) from an I/P transducer given a 13 mA input signal (4-20 mA range):
{\bullet} 13.0 PSI
{\bullet} 12.75 PSI
{\bullet} 10.8 PSI
{\bullet} 9.75 PSI
{\bullet} 13.4 PSI
{\bullet} 17.33 PSI
A pneumatic differential pressure transmitter has a calibrated range of $-100$ to +100 inches of water column (” W.C.), and its output signal range is 3 to 15 PSI. Complete the following table of values for this transmitter, assuming perfect calibration (no error). Be sure to show your work!
$$\begin{array} {|l|l|} \hline Input pressure & Percent of span & Output signal \\ \hline applied (“W.C.) & ( \\ \hline \0 & & \\ \hline $-30$ & & \\ \hline & & 8 \\ \hline & & 13 \\ \hline & 65 & \\ \hline & 10 & \\ \hline \end{array}$$
$$\begin{array} {|l|l|} \hline Input pressure & Percent of span & Output signal \\ \hline applied (“W.C.) & ( \\ \hline \0 & 50 & 9 \\ \hline $-30$ & 35 & 7.2 \\ \hline $-16.67$ & 41.67 & 8 \\ \hline 66.67 & 83.33 & 13 \\ \hline 30 & 65 & 10.8 \\ \hline $-80$ & 10 & 4.2 \\ \hline \end{array}$$
A turbine flowmeter measuring cooling water for a large power generator uses an electronic circuit to convert its pickup coil pulses into a 4-20 mA analog current signal. The ``K factor’’ for the turbine element is 99 pulses per gallon, and the 4-20 mA analog output is ranged from 0 to 500 GPM flow. Complete the following table of values for this transmitter, assuming perfect calibration (no error). Be sure to show your work!
$$\begin{array} {|l|l|} \hline Measured flow & Pickup signal & Percent of output & Output signal \\ \hline (GPM) & frequency (Hz) & span ( \\ \hline \250 & & & \\ \hline 412 & & & \\ \hline & 305 & & \\ \hline & 780 & & \\ \hline & & 63 & \\ \hline & & 49 & \\ \hline & & & 10 \\ \hline & & & 16 \\ \hline \end{array}$$
$$\begin{array} {|l|l|} \hline Measured flow & Pickup signal & Percent of output & Output signal \\ \hline (GPM) & frequency (Hz) & span ( \\ \hline \250 & 412.5 & 50 & 12 \\ \hline 412 & 679.8 & 82.4 & 17.18 \\ \hline 184.8 & 305 & 36.97 & 9.915 \\ \hline 472.7 & 780 & 94.55 & 19.13 \\ \hline 315 & 519.8 & 63 & 14.08 \\ \hline 245 & 404.3 & 49 & 11.84 \\ \hline 187.5 & 309.4 & 37.5 & 10 \\ \hline 375 & 618.8 & 75 & 16 \\ \hline \end{array}$$
Suppose you wish to calibrate a turbine flowmeter to an input range of 0 to 600 gallons per minute. The $k$ factor for this turbine is 20 pulses per gallon, making the input frequency range 0 to 200 Hz for this flow range. The output signal range is 4 to 20 mA. Complete the following calibration table showing the proper test frequencies and the ideal output signals at those levels:
$$\begin{array} {|l|l|} \hline Simulated flow & Input frequency & Percent of span & Output signal \\ \hline rate (GPM) & applied (Hz) & ( \\ \hline \97 & & & \\ \hline & & 25 & \\ \hline & & 60 & \\ \hline 400 & & & \\ \hline \end{array}$$
$$\begin{array} {|l|l|} \hline Simulated flow & Input frequency & Percent of span & Output signal \\ \hline rate (GPM) & applied (Hz) & ( \\ \hline \97 & 32.33 & 16.17 & 6.587 \\ \hline 150 & 50 & 25 & 8 \\ \hline 360 & 120 & 60 & 13.6 \\ \hline 400 & 133.3 & 66.6 & 14.67 \\ \hline \end{array}$$
Suppose you wish to calibrate a turbine flowmeter to an input range of 0 to 300 gallons per minute. The $k$ factor for this turbine is 80 pulses per gallon, making the input frequency range 0 to 400 Hz for this flow range. The output signal range is 4 to 20 mA. Complete the following calibration table showing the proper test frequencies and the ideal output signals at those levels:
$$\begin{array} {|l|l|} \hline Simulated flow & Input frequency & Percent of span & Output signal \\ \hline rate (GPM) & applied (Hz) & ( \\ \hline \ & & 17 & \\ \hline 130 & & & \\ \hline & & 45 & \\ \hline 300 & & & \\ \hline \end{array}$$
$$\begin{array} {|l|l|} \hline Simulated flow & Input frequency & Percent of span & Output signal \\ \hline rate (GPM) & applied (Hz) & ( \\ \hline \ 51 & 68 & 17 & 6.72 \\ \hline 130 & 173.33 & 43.33 & 10.933 \\ \hline 135 & 180 & 45 & 11.2 \\ \hline 300 & 400 & 100 & 20 \\ \hline \end{array}$$
Suppose you wish to calibrate a turbine flowmeter to an input range of 0 to 800 gallons per minute. The $k$ factor for this turbine is 30 pulses per gallon, making the input frequency range 0 to 400 Hz for this flow range. The output signal range is 4 to 20 mA. Complete the following calibration table showing the proper test frequencies and the ideal output signals at those levels:
$$\begin{array} {|l|l|} \hline Simulated flow & Input frequency & Percent of span & Output signal \\ \hline rate (GPM) & applied (Hz) & ( \\ \hline \55 & & & \\ \hline & & 25 & \\ \hline & & 63 & \\ \hline 700 & & & \\ \hline \end{array}$$
$$\begin{array} {|l|l|} \hline Simulated flow & Input frequency & Percent of span & Output signal \\ \hline rate (GPM) & applied (Hz) & ( \\ \hline \55 & 27.5 & 6.875 & 5.1 \\ \hline 200 & 100 & 25 & 8 \\ \hline 504 & 252 & 63 & 14.08 \\ \hline 700 & 350 & 87.5 & 18 \\ \hline \end{array}$$
An electronic pressure transmitter has a calibrated range of -10 to 60 PSI, and its output signal range is 4 to 20 mA. Complete the following table of values for this transmitter, assuming perfect calibration (no error). Be sure to show your work!
$$\begin{array} {|l|l|} \hline Input pressure & Percent of span & Output signal \\ \hline applied (PSI) & ( \\ \hline \0 & & \\ \hline -5 & & \\ \hline & & 12 \\ \hline & & 13.6 \\ \hline & 40 & \\ \hline & 22 & \\ \hline \end{array}$$
{\bf Partial answer:}
$$\begin{array} {|l|l|} \hline Input pressure & Percent of span & Output signal \\ \hline applied (PSI) & ( \\ \hline \0 & 14.29 & 6.286 \\ \hline -5 & & \\ \hline & & 12 \\ \hline 32 & 60 & 13.6 \\ \hline & 40 & \\ \hline & 22 & \\ \hline \end{array}$$
$$\begin{array} {|l|l|} \hline Input pressure & Percent of span & Output signal \\ \hline applied (PSI) & ( \\ \hline \0 & 14.29 & 6.286 \\ \hline -5 & 7.143 & 5.143 \\ \hline 25 & 50 & 12 \\ \hline 32 & 60 & 13.6 \\ \hline 18 & 40 & 10.4 \\ \hline 5.4 & 22 & 7.52 \\ \hline \end{array}$$
A pneumatic level transmitter has a calibrated range of 150 inches to 300 inches of liquid level, with an output range of 3 to 15 PSI. Complete the following table of values for this transmitter, assuming perfect calibration (no error):
$$\begin{array} {|l|l|} \hline Input level & Percent of span & Output signal \\ \hline applied (inches) & ( \\ \hline \ & 4 & \\ \hline & & 7.2 \\ \hline 189 & & \\ \hline \end{array}$$
$$\begin{array} {|l|l|} \hline Input level & Percent of span & Output signal \\ \hline applied (inches) & ( \\ \hline \156 & 4 & 3.48 \\ \hline 202.5 & 35 & 7.2 \\ \hline 189 & 26 & 6.12 \\ \hline \end{array}$$
{\bf This question is intended for exams only and not worksheets!}.
Suppose you wish to calibrate a pneumatic level transmitter to an input range of 0 to 400 inches, with an output range of 3 to 15 PSI. Complete the following calibration table showing the proper test levels and the ideal output signals at those levels:
$$\begin{array} {|l|l|} \hline Input level & Percent of span & Output signal \\ \hline applied (inches) & ( \\ \hline \ & 0 & \\ \hline & 25 & \\ \hline & 50 & \\ \hline & 75 & \\ \hline & 100 & \\ \hline \end{array}$$
$$\begin{array} {|l|l|} \hline Input level & Percent of span & Output signal \\ \hline applied (inches) & ( \\ \hline \ 0 & 0 & 3 \\ \hline 100 & 25 & 6 \\ \hline 200 & 50 & 9 \\ \hline 300 & 75 & 12 \\ \hline 400 & 100 & 15 \\ \hline \end{array}$$
{\bf This question is intended for exams only and not worksheets!}.
An ultrasonic level transmitter has a calibrated range of 40 to 75 inches and its output signal range is 4 to 20 mA. Complete the following table of values for this transmitter, assuming perfect calibration (no error). Be sure to show your work!
$$\begin{array} {|l|l|} \hline Measured level & Percent of span & Output signal \\ \hline (inches) & ( \\ \hline \47 & & \\ \hline & & 6 \\ \hline & 75 & \\ \hline 60 & & \\ \hline & & 15.1 \\ \hline & 34 & \\ \hline \end{array}$$
$$\begin{array} {|l|l|} \hline Measured level & Percent of span & Output signal \\ \hline (inches) & ( \\ \hline \47 & 20 & 7.2 \\ \hline 44.38 & 12.5 & 6 \\ \hline 66.25 & 75 & 16 \\ \hline 60 & 57.14 & 13.14 \\ \hline 64.28 & 69.38 & 15.1 \\ \hline 51.9 & 34 & 9.44 \\ \hline \end{array}$$
Published under the terms and conditions of the Creative Commons Attribution License


by Seth Price

by Seth Price