Facebook
 Google
 GitHub
 Linkedin
Using LabView for Fuel Cell HIL Simulation and Testing
Fuel cell simulation, modeling, and testing are vital to the expansion of fuel cell usage. But how can engineers specifically use LabVIEW for fuel cell hardware-in-the-loop (HIL) system simulation and testing?
Many developers are leveraging the power of LabVIEW to create user-friendly human-machine interfaces (HMIs) backed by complex controls system algorithms and calculations implemented using a graphical programming language.

Figure 1. An example VI front end that shows some of the various controls and feedback tools available in Labview. Image used courtesy of NI
LabVIEW
LabVIEW (Laboratory Virtual Instrument Engineering Workbench) is a graphical programming environment used to facilitate design, simulation, testing, control, and automation. Made by NI, a leader in instrumentation and automation, LabVIEW is widely used in academia, research, and industry.
How LabVIEW Supports Fuel Cell Simulation
While LabVIEW may often be associated with motor and motion control, its potential uses are many. There are numerous academic and corporate research papers detailing how LabVIEW is being used to model, simulate, and test fuel cells, such as the following:
- HIL simulation of a fuel cell for realistic inverter or DC-DC converter testing
- Designing, building, and testing a race car fuel cell system
- Controlling the world's largest fuel-cell hybrid locomotive
- Honda developed a new method for measuring fuel cell impedance
- FPGA-based HIL simulation of a fuel cell-powered vehicle’s power electronic system
- Ford implemented a fuel cell HIL test system
In addition, there are commercial fuel cell simulation tools that make use of LabVIEW.
Overview of LabVIEW
In LabVIEW, the programs are called VIs (virtual instruments), and the programming language is G. As alluded to earlier, LabVIEW is a graphical programming language and fully supports the creation of HMIs and GUIs (graphical user interfaces). Subroutines, or modules, are referred to as sub-VIs and enable LabVIEW programmers to take a highly modular approach to code development.
Each LabVIEW program consists of a minimum of two components: the front panel and the block diagram. The front panel serves as the HMI or GUI while the code is contained in the graphical block diagram.
LabVIEW VI Front Panel
The front panel provides (1) controls that allow the user access to key parameters for the VI and (2) indicators to provide feedback to the user. LabVIEW developers have a wide variety of options to choose from when creating a front panel, including buttons, sliders, dials, knobs, text boxes, toggles, and more for input.
For indicators, developers can choose from arrays, plots, tables, meters, gauges, and “LED” indicators, just to list a few. These various inputs and indicators must be associated correctly with the parameters and outputs in the block diagram.
The image below shows a very simple front panel for determining the area of a triangle. The input parameters are height and base, while the indicator, which in this example serves as output, is area. Height and base can be adjusted, but area cannot be.

Figure 2. Simple front panel for calculating the area of a triangle using Labview. Image used courtesy NI
LabVIEW VI Block Diagram
At the backend of the front panel lies the block diagram. Here is a summary of what comprises the backend of a VI:
- Controls, Indicators, and Constants, which acts as inputs and outputs
- Nodes, which perform operations and provide inputs/outputs
- Terminals, which act as entry and exit points for exchanging information between the block diagram and the front panel
- Wires, which connect the various parts of the block diagram and appear as lines
Nodes include items that are familiar to non-graphical programmers: functions, subprograms in the form of subVIs, and express VIs which are configured via a dialog box.
Continuing with the VI for determining the area of a triangle, the block diagram can take the form of the figure shown below. The controls are base (input of data type double) and height (input of data type double). The constant is triangular multiplier 0.5, and the indicator is area (output of data type double).
There are two nodes, both represented by a triangle with an x inside. Both nodes represent multiplication, and both require two inputs and generate one output. The indicator in this block diagram is area. The terminals are base, height, triangular multiplier, and area. The wires are the lines connecting everything together.

Figure 3. One possible block diagram for determining the area of a triangle using the front panel shown previously. Image used courtesy NI
Developing VIs for Fuel Cell HIL Simulation
The most difficult aspect of VI development lies in the block diagram. While graphical programming is used, a solid knowledge of control theory and the equipment that the VI is interacting with is needed. In addition, excellent troubleshooting and debugging skills are required.
Fuel cell simulation VIs are far more complex than the simple example discussed above. When used with instrumentation, there will be controls and indicators on the front end tied to equipment through the block diagrams.
Engineers specifically on a development team will need solid knowledge of how fuel cells work and how the equipment that the VI is tied to operates. This also leads to a more complex front end that must not only be designed to support input and indicators but also configured for easy, intuitive use.

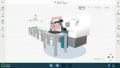
Figure 4. Example of a VI showing the fuel cell characteristic curve and defining the fuel cell output. Image used courtesy of EA Elektro-Automatik
LabVIEW is a unique tool for fuel cell simulation when the VI is created by a knowledgeable team who understands how the instrumentation is used and how to create effective HMIs.
An example of such an application is EA Elektro-Automatik’s VI for fuel cell simulation and testing that uses bidirectional DC power supplies and regenerative DC loads to simulate either a fuel cell or a real-world load acting on a fuel cell stack. Using LabVIEW, EA Elektro-Automatik aimed to develop an extensive group of VIs for controlling power supplies and DC loads for testing and tracking the behavior of a fuel cell system.
Featured Image used courtesy of EA Elektro-Automatik, Inc.