 Facebook
 Google
 GitHub
 Linkedin
Indicators, Recorders, Process Switches and Alarms
So far we have just looked at instruments that sense, control, and influence process variables. Transmitters, controllers, and control valves are respective examples of each instrument type. However, other instruments exist to perform useful functions for us.
Indicators
One common “auxiliary” instrument is the indicator, the purpose of which is to provide a human-readable indication of an instrument signal. Quite often process transmitters are not equipped with readouts for whatever variable they measure: they just transmit a standard instrument signal (3 to 15 PSI, 4 to 20 mA, etc.) to another device. An indicator gives a human operator a convenient way of seeing what the output of the transmitter is without having to connect test equipment (pressure gauge for 3-15 PSI, ammeter for 4-20 mA) and perform conversion calculations. Moreover, indicators may be located far from their respective transmitters, providing readouts in locations more convenient than the location of the transmitter itself. An example where remote indication would be practical is shown here, in a nuclear reactor temperature measurement system:
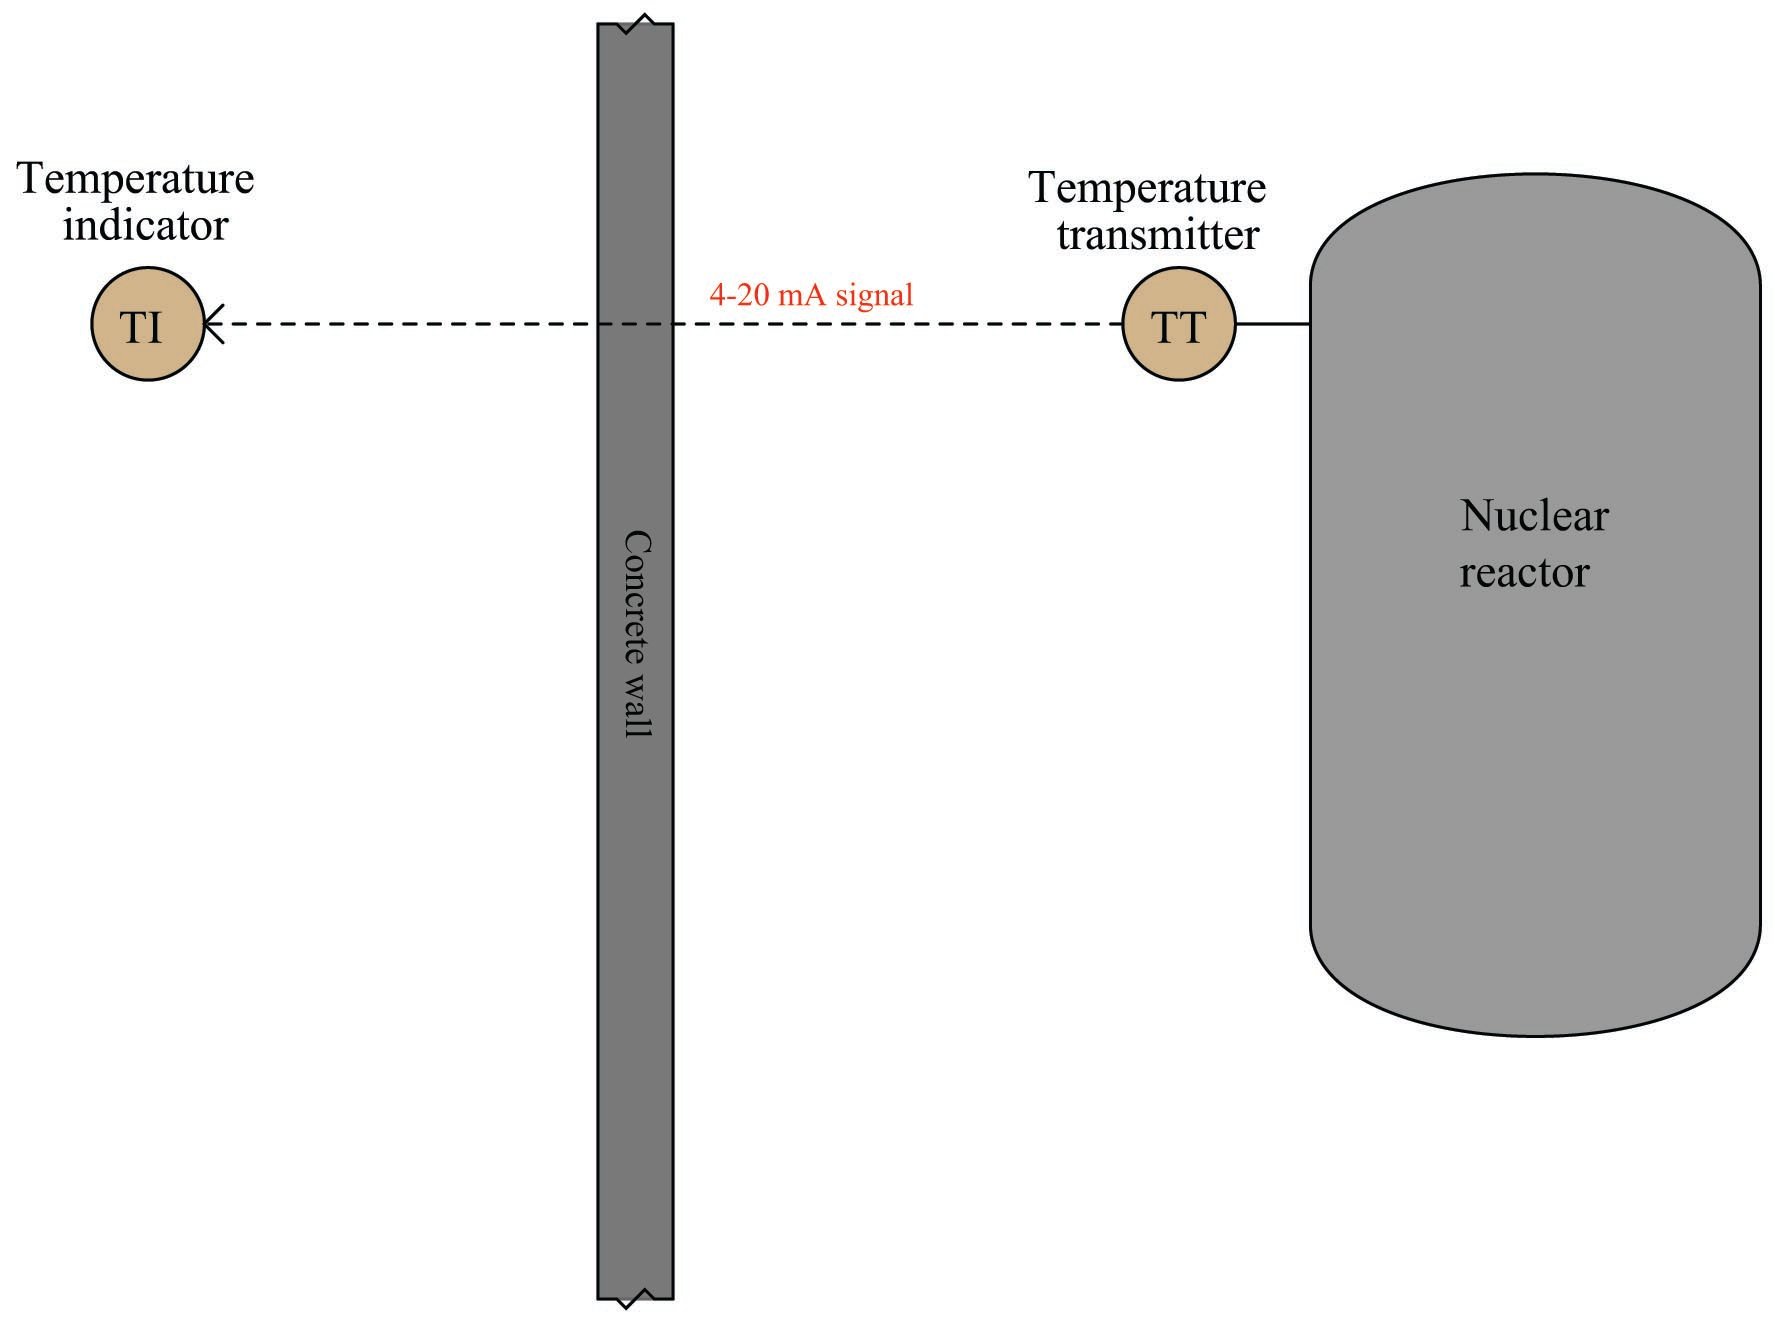
It would be unsafe for human beings to approach the nuclear reactor when it is in full-power operation, due to the strong radiation flux it emits. The temperature transmitter is built to withstand the radiation, though, and it transmits a 4 to 20 milliamp electronic signal to an indicating recorder located on the other side of a thick concrete wall blocking the reactor’s radiation, where it is safe for human occupancy. There is nothing preventing us from connecting multiple indicators, at multiple locations, to the same 4 to 20 milliamp signal wires coming from the temperature transmitter. This allows us to display the reactor temperature in as many locations as we desire, since there is no absolute limit on how far we may conduct a DC milliamp signal along copper wires.
A numerical-plus-bargraph indicator appears in this next photograph, mounted in the face of a metal panel inside of a control room:

This particular indicator shows the position of a flow-control gate in a wastewater treatment facility, both by numerical value (98.06%) and by the height of a bargraph (very near full open – 100%). It is directly wired in series with the same 4-20 milliamp current signal sent to the gate actuator.
A less sophisticated style of panel-mounted indicator shows only a numeric display, such as this unit shown here:

Indicators may also be used in “field” (process) areas to provide direct indication of measured variables if the transmitter device lacks a human-readable indicator of its own. The following photograph shows a field-mounted indicator, operating directly from the electrical power available in the 4-20 mA loop. The numerical display of this indicator uses LCD technology rather than red-glowing LEDs, in order to use less electrical power:

Recorders
Another common “auxiliary” instrument is the recorder (sometimes specifically referred to as a chart recorder or a trend recorder), the purpose of which is to draw a graph of process variable(s) over time. Recorders usually have indications built into them for showing the instantaneous value of the instrument signal(s) simultaneously with the historical values, and for this reason are usually designated as indicating recorders. A temperature indicating recorder for the nuclear reactor system shown previously would be designated as a “TIR” accordingly.
Paper chart recorders are a form of instrumentation with a long history. The following image shows an illustration of a Bristol brand recording pressure gauge found on page 562 of Cassier’s Magazine volume 8, published in 1895. Note the circular form of the paper chart, allowing the pen to draw a trace as the circular chart slowly spins. A padlock on the front glass cover prevents tampering with the chart recording:

A typical chart from one of these recording devices is shown in this illustration, taken from page 563 of the same engineering periodical:

This particular recording is of a steam boiler’s pressure over a 24-hour period, showing pressure build-up beginning at 4:00 AM and boiler shut-down at 9:30 PM. This steam boiler’s pressure appears to have been operated at approximately 70 PSI. Dips and peaks in the trace reflect changes in steam demand as well as irregularities in the firing of the boiler’s coal furnace.
Another design of paper chart recorder is the strip style, using a long strip of paper between two spools (one to play out the paper and another to take it up). Like the circular chart recorder design, the strip chart recorder also has a long history. The following illustration from page 560 of the same Cassier’s Magazine volume:

This next image shows a practical example of a strip chart’s record for a city water supply company, taken from page 566 of the same periodical:

Several interesting details may be seen on this particular recording, including pressure fluctuations caused by periodic draws of water from a fire hydrant to fill street carts used to spray the city’s dirt roads with water to minimize dust. Pressure drop caused by a burst 4-inch water pipe is also seen on this recording, between 5:00 PM and 6:15 PM.
Both circular and strip chart recorder designs survive to this day. Two circular chart recorders are shown in the following photograph, used to record temperatures at a powdered milk processing facility:

Two more chart recorders appear in the next photograph, a strip chart recorder on the right and a paperless chart recorder on the left. The strip chart recorder uses a scroll of paper drawn slowly past one or more lateral-moving pens, while the paperless recorder does away with paper entirely by plotting graphic trend lines on a computer screen:

Recorders are extremely helpful for troubleshooting process control problems. This is especially true when the recorder is configured to record not just the process variable, but also the controller’s setpoint and output variables as well. Here is an example of a typical “trend” showing the relationship between process variable, setpoint, and controller output in automatic mode, as graphed by a recorder:

Here, the setpoint (SP) appears as a perfectly straight red line, the process variable as a slightly erratic blue line, and the controller output as a moderately erratic purple line. We can see from this trend that the controller is doing exactly what it should: holding the process variable value close to setpoint, manipulating the final control element as far as necessary to do so. The chaotic appearance of the output signal is not really a problem, contrary to most peoples’ first impression. The fact that the process variable never deviates significantly from the setpoint tells us the control system is operating quite well. What accounts for the erratic controller output, then? The answer to this question is any factor requiring the controller to change its output in order to maintain the process variable at setpoint. Variations in process load would account for this: as other variables in the process change over time, the controller is forced to compensate for these variations in order to ensure the process variable does not drift from setpoint. Referencing our previous example of a steam boiler water level control system, one of these influencing variables is steam demand. If this trend shows the steam drum water level (PV) and feedwater valve position (Output), variations in the controller’s output signal could be indicative of steam demand rising and falling, the controller modulating water flow into the boiler to properly compensate for this load and maintain a fairly constant steam drum water level. A wildly-fluctuating output signal may indicate a problem somewhere else in the process (placing undue demands on the control system), but there is certainly no problem with the control system itself: it is doing its job perfectly well.
Recorders become powerful diagnostic tools when coupled with the controller’s manual control mode. By placing a controller in “manual” mode and allowing direct human control over the final control element (valve, motor, heater), we can tell a lot about a process. Here is an example of a trend recording for a process in manual mode, where the process variable response is seen graphed in relation to the controller output as that output is increased and decreased in steps:

Notice the time delay between when the output signal is “stepped” to a new value and when the process variable responds to the change. This delay is called dead time, and it is generally detrimental to control system performance. Imagine trying to steer an automobile whose front wheels respond to your input at the steering wheel only after a 5-second delay! This would be a very challenging car to drive. The same problem plagues any industrial control system with a time lag between the final control element and the transmitter. Typical causes of this problem include transport delay (where there is a physical delay resulting from transit time of a process medium from the point of control to the point of measurement) and mechanical problems in the final control element.
This next example shows another type of problem revealed by a trend recording during manual-mode testing:

Here, we see the process quickly responding to all step-changes in controller output except for those involving a change in direction. This problem is usually caused by mechanical friction in the final control element (e.g. “sticky” valve stem packing in a pneumatically-actuated control valve), and is analogous to “loose” steering in an automobile, where the driver must turn the steering wheel a little bit extra after reversing steering direction. Anyone who has ever driven an old farm tractor knows what this phenomenon is like, and how it detrimentally affects one’s ability to steer the tractor in a straight line.
Sometimes it becomes useful to temporarily place a recorder into an instrumentation system for diagnostic purposes. On the simplest level, this might consist of a digital multimeter (DMM) connected to measure signal voltage or current, with its “minimum/maximum” capture mode engaged. On a more complex level, this might be a personal computer running data graphing software, connected to the instrumentation circuit through a data acquisition (DAQ) module converting the circuit’s analog voltage or current signals into digital values readable by the computer.
Process switches and alarms
Another type of instrument commonly seen in measurement and control systems is the process switch. The purpose of a switch is to turn on and off with varying process conditions. Usually, switches are used to activate alarms to alert human operators to take special action. In other situations, switches are directly used as control devices.
The following P&ID of a compressed air control system shows both uses of process switches:

The “PSH” (pressure switch, high) activates when the air pressure inside the vessel reaches its high control point. The “PSL” (pressure switch, low) activates when the air pressure inside the vessel drops down to its low control point. Both switches feed discrete (on/off) electrical signals to a logic control device (symbolized by the diamond) which then controls the starting and stopping of the electric motor-driven air compressor.
Another switch in this system labeled “PSHH” (pressure switch, high-high) activates only if the air pressure inside the vessel exceeds a level beyond the high shut-off point of the high pressure control switch (PSH). If this switch activates, something has gone wrong with the compressor control system, and the high pressure alarm (PAH, or pressure alarm, high) activates to notify a human operator.
All three switches in this air compressor control system are directly actuated by the air pressure in the vessel: in other words, these are direct process-sensing switches. It is possible, however, to build switch devices that interpret standardized instrumentation signals such as 3 to 15 PSI (pneumatic) or 4 to 20 milliamps (analog electronic), allowing us to build on/off control systems and alarms for any type of process variable measurable with a transmitter.
For example, the chlorine wastewater disinfection system shown earlier may be equipped with a couple of electronic alarm switches to alert an operator if the chlorine concentration ever exceeds pre-determined high or low limits:

The labels “AAL” and “AAH” refer to analytical alarm low and analytical alarm high, respectively. Note how the diagram shows these two alarm units connected to the electronic (4-20 mA) signal output by the chlorine analyzer (AT). This tells us the AAL and AAH alarm units are really just electronic circuits, alarming if the analytical transmitter’s 4-20 mA analog signal falls below (AAL) or exceeds (AAH) certain pre-set limits. As such, the AAL and AAH alarms do not directly sense the chlorine concentration in the water, but rather indirectly sense it by monitoring the chlorine analyzer’s 4-20 milliamp output signal.
Since both alarms work off the 4 to 20 milliamp electronic signal output by the chlorine analytical transmitter (AT) rather than directly sensing the process, their construction is greatly simplified. If these were process-sensing switches, each one would have to be equipped with the analytical capability of directly sensing chlorine concentration in water. In other words, each switch would have to be its own self-contained chlorine concentration analyzer, with all the attendant complexity.
An example of an electronic alarm module (triggered by a 4-20 mA current signal coming from a transmitter) is the Moore Industries model SPA (“Site Programmable Alarm”), shown here:

In addition to providing alarm capability, this SPA module also provides a digital display (a small LCD screen) to show the analog signal value for operational or diagnostic purposes.
Like all current-operated alarm modules, the Moore Industries SPA may be configured to “trip” electrical contacts when the current signal reaches a variety of different programmed thresholds. Some of the alarm types provided by this unit include high process, low process, out-of-range, and high rate-of-change.
In a similar manner, we may add pressure-actuated process alarm switches to pneumatic (3-15 PSI) signal lines coming from pneumatic transmitters to add alarm capability to a system designed for continuous measurement. For example, if high- and low-alarm capability were desired for the steam drum water level process described earlier in this chapter, one could add a pair of pressure-actuated switches to the pneumatic level transmitter’s 3-15 PSI output signal line:

These two pressure-actuated switches serve as water level alarms, because the air pressure signal actuating them comes from the pneumatic level transmitter, which outputs an air pressure signal in direct proportion to water level in the boiler’s steam drum. Even though the physical stimulus actuating each switch is an air pressure, the switches still serve the purpose of liquid level alarm signaling because that air pressure is an analogue (representation) of water level in the steam drum. In other words, these two alarm switches (LSL and LSH) indirectly sense water level by monitoring the pneumatic signal pressure output by the level transmitter (LT).
The alternative to pressure-actuated water level alarm switches would be independent level-sensing switches attached directly to the steam drum, each switch equipped with its own means231 of directly sensing water level:

It should be mentioned that the choice between using process alarm switches directly actuated by the process versus alarm switches actuated by a transmitter’s analog signal is not arbitrary. In the system where the two alarm switches actuate from the transmitter’s 3-15 PSI output signal, the integrity of the water level control and that of the high- and low-level alarms all depend on the proper function of one transmitter. If that one transmitter were to fail, all three system functions would be compromised. This elevates the importance of a single instrument, which is generally not desirable from the perspective of reliability and process safety. In the system where each level alarm switch independently senses steam drum water level, one device may fail without compromising either of the other two functions. This independence is desirable because it greatly reduces the probability of “common-cause” failures, where a single fault disables multiple system functions. The final determination should be based on a rigorous analysis of device versus system reliability, which is typically the task of a process engineer.
Process alarm switches may be used to trigger a special type of indicator device known as an annunciator. An annunciator is an array of indicator lights and associated circuitry designed to secure a human operator’s attention by blinking and sounding an audible buzzer when a process switch actuates into an abnormal state. The alarm state may be then “acknowledged” by an operator pushing a button, causing the alarm light to remain on (solid) rather than blink, and silencing the buzzer. The indicator light does not turn off until the actual alarm condition (the process switch) has returned to its regular state.
This photograph shows an annunciator located on a control panel for a large engine-driven pump. Each white plastic square with writing on it is a translucent pane covering a small light bulb. When an alarm condition occurs, the respective light bulb flashes, causing the translucent white plastic to glow, highlighting to the operator which alarm is active:

Note the two pushbutton switches below labeled “Test” and “Acknowledge.” Pressing the “Acknowledge” button will silence the audible buzzer and also turn any blinking alarm light into a steady (solid) alarm light until the alarm condition clears, at which time the light turns off completely. Pressing the “Test” button turns all alarm lights on, to ensure all light bulbs are still functional.
Opening the front panel of this annunciator reveals modular relay units controlling the blinking and acknowledgment latch functions, one for each alarm light:

This modular design allows each alarm channel to be serviced without necessarily interrupting the function of the other channels in the annunciator panel.
A simple logic gate circuit illustrates the acknowledgment latching feature (here implemented by an S-R latch circuit) common to all process alarm annunciators:

Panel-mounted annunciators are becoming a thing of the past, as computer-based alarm displays replace them with advanced capabilities such as time logging, first-event233 recording, and multiple layers of acknowledgment/access. Time logging is of particular importance in the process industries, as the sequence of events is often extremely important in investigations following an abnormal operating condition. Knowing what happened, and exactly when it happened is much more informative than simply knowing which alarms have tripped.
