 Facebook
 Google
 GitHub
 Linkedin
Material Volume Measurement
Volume measurement for liquid or loose solids is based on the container shape
Even when the fill rate is constant, the shape of the container may not lead to a linear fill rate. It can be determined by experimentation or by mathematics.
A variety of technologies exist to measure the quantity of stored material in a vessel. For liquid applications, hydrostatic pressure, radar, ultrasonic, and tape-and-float are just a few of the more common technologies:
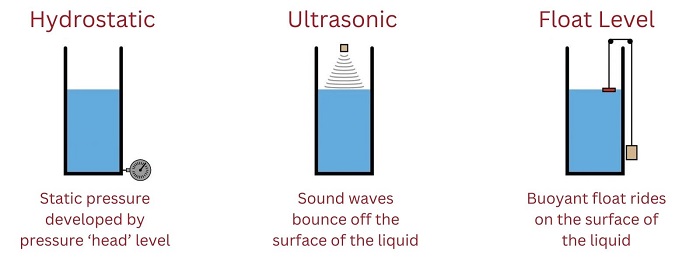
These measuring technologies share a common trait: they infer the quantity of material stored in the vessel by measuring height. If the vessel in question has a constant cross-sectional area throughout its working height (e.g., a vertical cylinder), then material height will directly correspond to stored material volume. However, if the vessel in question does not have a constant cross-sectional area throughout its height, the relationship between material height and material volume will not be linear.
For example, there is a world of difference between the height/volume functions for a vertical cylinder versus a horizontal cylinder:
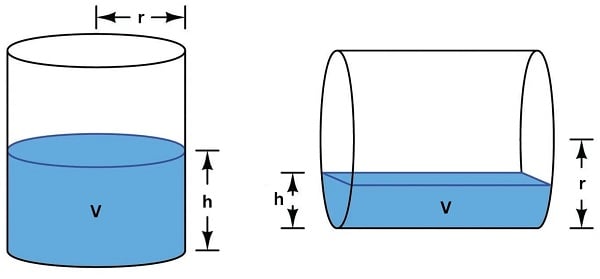
The volume function for a vertical cylinder is a simple matter of geometry – height (\(h\)) multiplied by the cylinder’s cross-sectional area (\(\pi r^2\)):
\[V = \pi r^2 h\]
Calculating the volume of material stored inside a horizontal cylinder as a function of material height (\(h\)) is a far more complicated matter because the cross-sectional area is not constant. The solution to this problem is an exercise in integral calculus, the final result being this unwieldy function:
\[V = L \left[ (h-r) \sqrt{2hr - h^2} + r^2 \sin^{-1}{(h-r) \over r} + {\pi r^2 \over 2} \right]\]
Any instrumentation system inferring stored material volume by measurement of material height in a horizontal cylinder must somehow apply this formula on a continuous basis. This is a prime example of how digital computer technology is essential to certain continuous measurement applications!
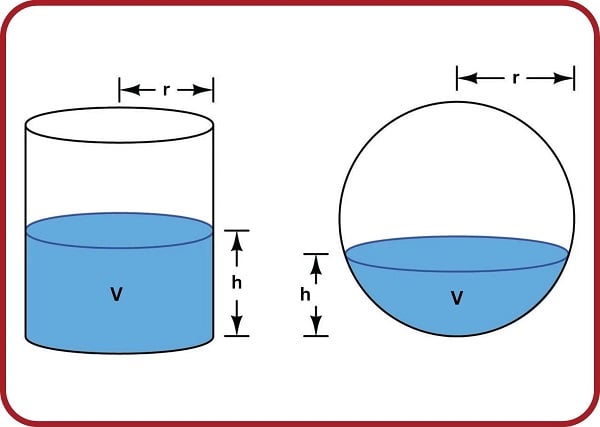
Spherical vessels, such as those used to store liquefied natural gas (LNG) and butane, present a similar challenge: the material height/volume function is more complicated than for a vertical cylinder because the cross-sectional area of a spherical vessel changes with height. Once again, an exercise in integral calculus is necessary to derive a formula for calculating the stored volume of material inside a sphere based on material height:
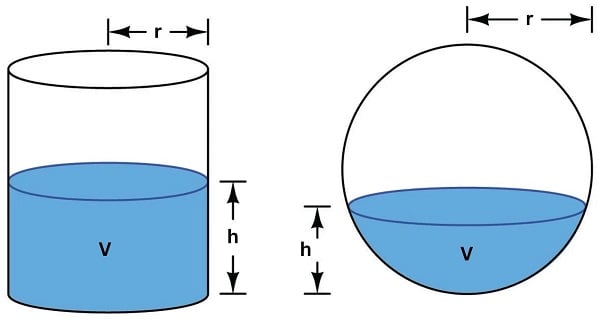
Whereas the material volume function for a vertical cylinder is a simple linear formula (\(V = \pi r^2 h\)), the material volume formula for a sphere is a bit more complicated although not as complicated as it is for a horizontal cylinder:
\[V = \pi h^2 \left(r - {h \over 3}\right)\]
This function will “un-do” the inherent height/volume nonlinearity of a spherical vessel, allowing a height measurement to translate directly into a volume measurement. A “characterizing” function such as this is typically executed in a digital computer connected to the level sensor, sometimes in a computer chip within the sensor device itself.
An interesting alternative to a formal equation for linearizing the level measurement signal is something called a multi-segment characterizer function, typically implemented as a function block inside a digital loop controller or distributed control system (DCS). This is an example of what mathematicians call a piecewise function: a function made up of line segments. Multi-segment characterizer functions may be programmed to emulate virtually any continuous function, with reasonable accuracy:
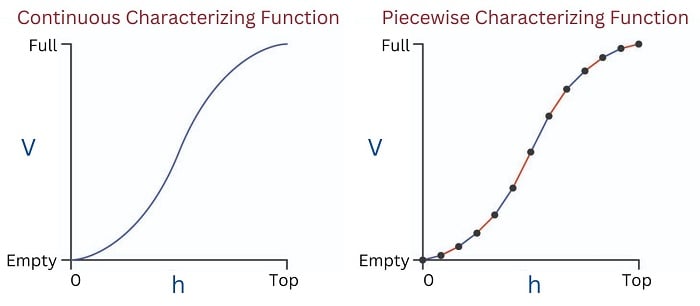
The computer correlates the input signal (height measurement, \(h\)) to a point on this piecewise function, linearly interpolating between the nearest pair of programmed coordinate points. The number of points available for multi-point characterizers varies between ten and one hundred depending on the desired accuracy and the available computing power.
Although true fans of math might blanch at the idea of approximating an inverse function for level measurement using a piecewise approach rather than simply implementing the correct continuous function, the multi-point characterizer technique does have certain practical advantages. For one, it is readily adaptable to any shape of vessel, no matter how strange. Take for instance this vessel, made of separate cylindrical sections welded together:
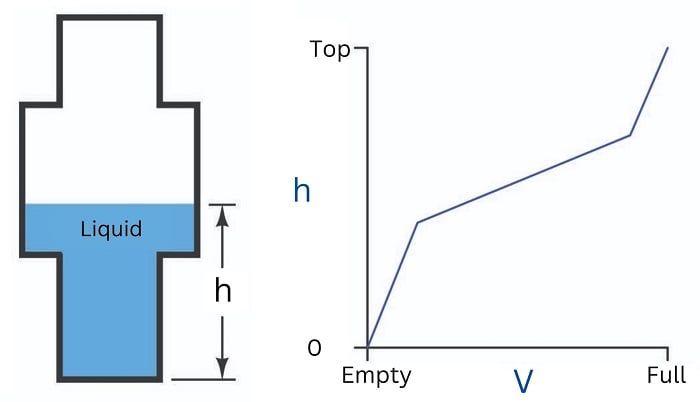
Here, the vessel’s very own height/volume function is fundamentally piecewise, and so nothing but a piecewise characterizing function could possibly linearize the level measurement into a volume measurement!
Consider also the case of a spherical vessel with odd-shaped objects welded to the vessel walls, and/or inserted into the vessel’s interior:
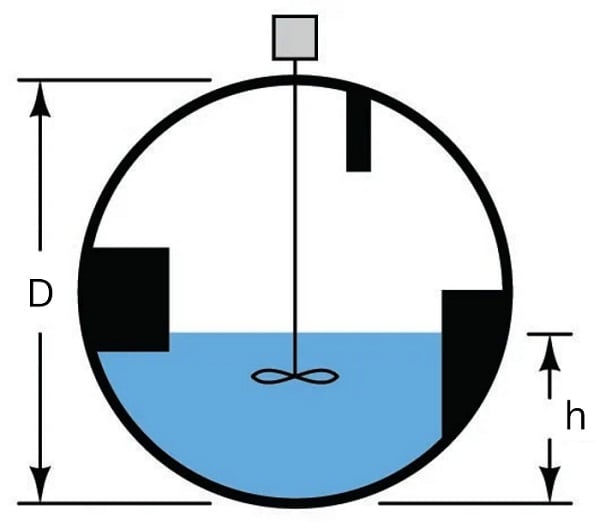
The volumetric space occupied by these structures will introduce all kinds of discontinuities into the transfer function, and so once again we have a case where a continuous characterizing function cannot properly linearize the level signal into a volume measurement. Here, only a piecewise function will suffice.
To best generate the coordinate points for a proper multi-point characterizer function, one must collect data on the storage vessel in the form of a strapping table. This entails emptying the vessel completely, then filling it with measured quantities of material, one sample at a time, and taking level readings. The result of this exercise is a data table correlating known volumes of material inside the vessel with measured heights of that material:
| Introduced material volume | Measured material level |
|---|---|
| 150 gallons | 2.46 feet |
| 300 gallons | 4.72 feet |
| 450 gallons | 5.8 feet |
| 600 gallons | (etc.) |
| 750 gallons | (etc.) |
Each of these paired numbers would constitute the coordinates to be programmed into the characterizer function computer by the instrument technician or engineer:
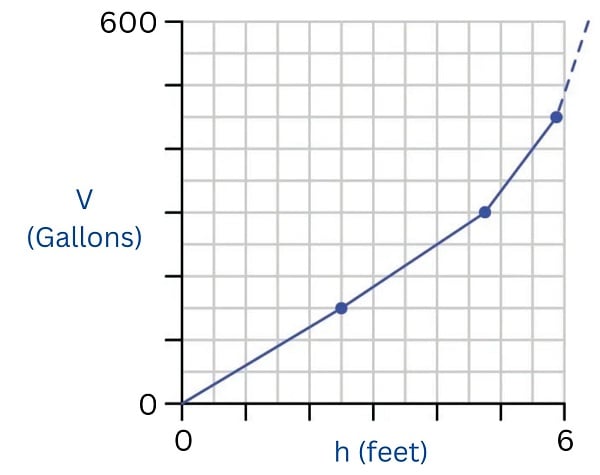
With this programmed function, the computer is able to infer material volume quite accurately from the height measurement reported by a level transmitter.
Many “smart” level transmitter instruments possess enough computational power to perform the level-to-volume characterization directly, so as to transmit a signal corresponding directly to material volume rather than just material level. This eliminates the need for an external “level computer” to perform the necessary characterization. The following screenshot was taken from a personal computer running configuration software for a radar level transmitter, showing the strapping table data point fields where a technician or engineer would program the vessel’s level-versus-volume piecewise function:
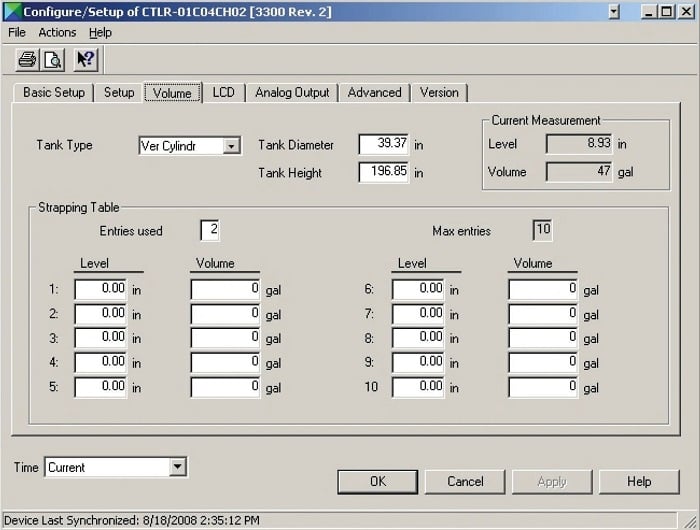
This configuration window actually shows more than just a strapping table. It also shows the option of calculating volume for different vessel shapes (vertical cylinder is the option selected here) including horizontal cylinder and sphere. In order to use the strapping table option, the user would have to select “Strapping Table” from the list of Tank Types. Otherwise, the level transmitter’s computer will attempt to calculate volume from an ideal tank shape.
Solid material volume measurement poses unique problems over liquid material volume measurement because solids, unlike liquids, are not self-leveling. A common problem encountered in measuring the level of a solid (chip, granular, or powder) inside a vessel is the angle of repose created when that material forms a pile inside the vessel:
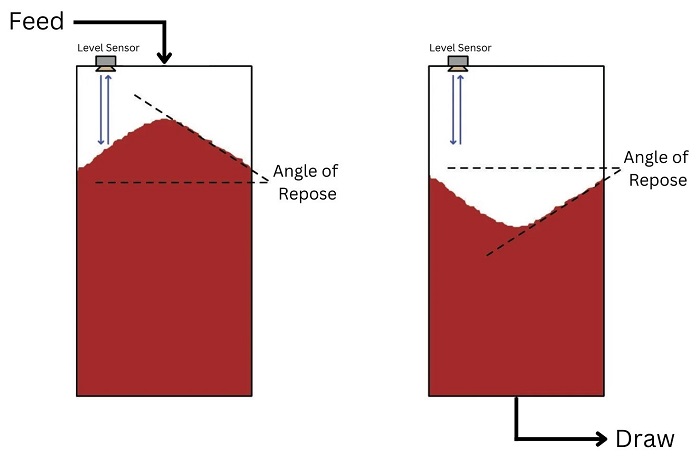
It should be clear from the above illustration that any level sensor detecting the level of the solid material at any one point inside the vessel will usually yield a misleading result because it cannot sense variations in material level across the whole surface. This problem exists regardless of level sensor type (e.g., ultrasonic, radar, tape) so long as that sensor only senses material level at one point. Liquid material applications do not pose this problem because liquids naturally self-level, achieving a relatively flat surface by nature.
A modern solution to this measurement problem is to use an array of echo-based sensors to generate a three-dimensional map of the solid material surface, and then compute material volume based on all height measurements spanning the vessel’s cross-section. One such instrument designed for this purpose is Rosemount’s model 5708 3D Solids Scanner.
