Facebook
 Google
 GitHub
 Linkedin
8 Steps To Successful Predictive Maintenance Implementation (with examples)
We'll run through the eight basic steps for implementing a predictive maintenance strategy in your business to improve critical asset availability, reduced maintenance costs, and enhanced revenues over time.
If you're interested in implementing predictive maintenance (PdM) strategy in your business but struggle to know where to start and the actions to take, we'll run through the eight basic steps you need to consider. To illustrate the steps, we'll use an example of a wind turbine—but each step is equally pertinent to the equipment you operate in your organization.
1. Identify a Critical Piece of Equipment
Implementing PdM for an asset involves upfront investment in technology, including sensors, networking, an analytics engine, cloud computing capability, and a computerized maintenance management system (CMMS).
Given the technological investment required, assets selected for PdM should be highly valued, have a high repair and replacement cost, or be critically important to your operation. The money spent on technology should be offset by the reduced costs of ongoing preventative maintenance, extended downtime, and reactive maintenance.
Our example for monitoring is a wind turbine. It's an expensive asset with high maintenance costs and breakdowns taking a while to repair due to geographical isolation, height, and the availability of spares. Any reduction in the urgent repair costs and the loss of revenue provides a good return on the technological investment in PdM.

Figure 1. A computerized maintenance management system (CMMS) can provide a baseline for creating and training the operating model and compare data over time. Image used courtesy of Limble CMMS
2. Collect Existing Maintenance Data to Baseline Prior Performance
Predictive maintenance needs data from in-service experience and steady-state operations against which to compare current operations. While the analytics engine will collect operating data over time, having maintenance records or CMMS data provides a baseline for creating and training the operating model.
For our wind turbine, knowing the frequency of prior planned maintenance events, the mean time between failure (MTBF) of critical components, and the length and cost of both maintenance and breakdown activities, allows us to analyze our investment and calculate our return. It also allows the analytics engine to start with an average MTBF figure.
3. Identify Failure Modes
PdM is a targeted maintenance strategy, given the volume of data created and the cost of sensors and monitoring. Focus on the frequency of specific failure modes, their severity or costs, and the ease of identifying component deterioration before failure. If standard preventative maintenance tasks will militate against failure, PdM's added cost and complexity are unwarranted. Yet, if failure modes to date have been random and expensive, PdM may provide the solution.
Predominant failures in wind turbines are rotating components. These include power transmission losses due to frictional degradation, bearing failure from a shaft or bearing misalignment, or structural cracks from vibration. They are difficult to identify until they have progressed to a stage requiring major intervention, with rectification prolonged and expensive, causing considerable revenue loss.

Figure 2. Data from sensors is used to create inferences on an asset's future state and support informed operational and maintenance intervention decisions. Image used courtesy of Limble CMMS
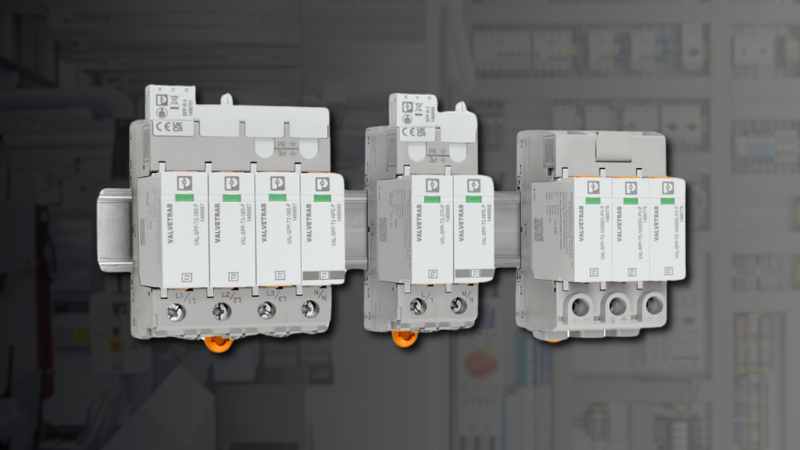
4. Install Appropriate Sensors
The seven most common off-the-shelf sensors measure proximity, audio, light, force, humidity, acceleration, and temperature, with many measuring multiple physical data sources. Custom sensors are also developed for specific applications. These commonly measure torque, wear, cracking, or oil status and use ultrasound, radiography, magnetic particle inspection, and shearography. Your sensor data should allow inferences on an asset's future state and support informed operational and maintenance intervention decisions.
Wind turbine rotating components produce a stable acoustic signature that resonates through the nacelle and tower structure. These signals are relatively stable over time and indicate the asset's health, with changes suggesting degradation. By installing network-connected acoustic emission sensors on the turbine's tower, three distinct acoustic patterns can suggest increased bearing or gearbox friction, shaft or bearing misalignment, and cracks that alter the frequency harmonics of the signals. We can track deterioration, isolate the issue, and plan the spares, personnel, and downtime for targeted intervention, minimizing the impacts of catastrophic failure.
5. Record Data and Build Machine Learning (ML) Models
This step requires data scientist expertise. You'll receive considerable raw data from your sensors, requiring cleaning and aggregation to be meaningful and actionable. This process will entail down-sampling or over-sampling datasets and synchronizing sensor data and maintenance record data. Algorithm selection is the next step before training and testing the model's accuracy. Once the best model is selected, it can be deployed and monitored to measure whether the model drifts and requires retraining.
The machine learning algorithm for our turbine monitoring will treat the baseline signals from normal operation as background or Gaussian white noise. Such a model monitors exceedances, spikes, or diversions from the norm. Each pattern identifies the location of the deterioration and predicts failure within a given time window, allowing early detection, monitoring, and planned inspection or rectification.
6. Allow Machine Learning Algorithms to Improve
While there are multiple machine learning methods, semi-supervised learning is common. The analytics engine begins training on data tagged or sorted by our data scientists before continuing to self-manage the data organization and learning. Over time, the model becomes more accurate, backed by greater data from multiple operating scenarios, and enhanced by correlated maintenance outcomes.
7. Implement Alert Thresholds
The semi-supervised learning approach uses alert thresholds or boundaries agreed between the maintenance, engineering, and data science personnel to trigger the initial predictions. Over time, the predictions will refine, becoming increasingly accurate with maintenance findings fed back into the model to align the as-found conditions with the predicted asset states.

Figure 3. In the CMMS, data from the physical world is collected and digitized. Insights from this can then be used back in the physical world. This is a three step process called the physical-to-digital-to-physical loop. Image used courtesy of Limble CMMS
8. Use a CMMS to Raise a Work Order on Anomaly Detection
PdM relies on an iterative set of three steps called the physical-to-digital-to-physical loop. Data is collected from the physical world and digitized. The data is cleaned, shared, and analyzed within the digital portion to gain actionable insight or predictions. The final step requires the flow of this digital insight back to the physical world to implement concrete actions.
In our wind turbine example, we use a CMMS to affect the final step of this loop. The CMMS receives the output from the prediction engine and raises alerts for urgent events or work orders for planned interventions. The task is defined, with spare parts and personnel resources scheduled, within the time window of the prediction. With the task completed in the physical world, the findings and outcomes are captured within the CMMS and fed back to the prediction engine for improved learning outcomes.
Conclusion
When first implementing predictive maintenance, start small. Use one or two critical assets on which to develop your predictive maintenance program. Resist the urge to use too many sensors or to scale your predictive program too quickly. Allow the algorithm to stabilize while quantifying the projected returns on your investment. Follow the steps, and with careful and systematic implementation, you can expect improved critical asset availability, reduced maintenance costs, and enhanced revenues over time.