Facebook
 Google
 GitHub
 Linkedin
Analysis Tools for Air Quality Measurement
Air quality measurement monitoring systems incorporate both hardware and software. This article discusses the key parts that go into these systems and discusses how they work.
The analytics for air quality measurements are provided by monitoring air quality and storing data for different quality requirements. It performs the automated analysis depending on the different threshold and setpoint levels as defined by the users. The automated analysis relieves the technical personnel of decision making, allowing them to instead focus more on preventive or corrective actions.
The increased greenhouse effect has put pressure on industries to reduce their global warming footprint. In addition to other environmental and health benefits, healthy air also indicates an efficient production process. This efficiency is a result of the optimum use of different raw materials and utilities such as HVAC, electricity, and water. Air quality measurements combined with different analysis tools are most beneficial for maintaining the highest performance.
Tools for Air Quality Monitoring Systems
There are a few essential analytical tools used in air quality measurement monitoring systems. The monitoring system includes different sensors for detecting the concentration of different gases and particulate matter.

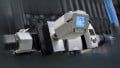
Figure 1. An example of an air quality monitoring system from NetOP.
Sensors are strategically located to get the maximum exposure of the emission source. The sensors are selected based on the type of emission and what production process is happening. Different environmental conditions such as temperature affect the output of these sensors, and the location must be such that is has minimum effect on environmental conditions.
Most monitoring systems include:
- Software
- HVAC system
- Display
Software
The software part takes the responsibility of monitoring the data from the sensors and executing different analyses. The required analyses can be set by the user and are agreed upon and developed at the initial stage of procurement. The software's key job is analyzing the data coming from different locations and setting up acceptable levels to maintain air quality throughout the region of interest.
The software also manages devices spread across the facility in case of a fault or malfunction. It has the capability to detect a problem with any measuring station, generating alerts for corrective action of the faulty devices.
HVAC System
The HVAC system is comprised of different components that purify the air and manage the environment according to the requirements — components include air blowers, filters, and an interconnected duct system that cleans and supplies the air according to required parameters.
All the HVAC’s environmental parameters and operation is controlled and monitored through a centralized system. The monitoring sensors also connect to the centralized system.
If the readings deviate from the standard values, the analytics automatically initiate actions to correct the air quality and trigger an alarm system to implement the corrective actions. When parameters are normal, all the alarm systems and operating conditions return to a normal state.
Display
The display of a monitoring system provides a comprehensive interface for the technical personnel in charge of air quality system management. It provides an interface for viewing the current state to generate reports and historical trends.
The display is fully customizable as required by the organization and is agreed upon during the initial stages of procurement.
Air Quality Analytics: Hardware and Software
The analytics for air quality measurements is divided into hardware and software. The hardware collects the data and performs the acquisition of the values from the physical sensors deployed across the monitored area. It also includes the different connected components. The software has the responsibility of storing databases of different variables and values, processing the information following the algorithm, and triggering an alarm management system.
Software: Databases and Recording
The software uses databases to store critical variables and relevant information. Previously, it was the practice of recording and storing data manually on paper.
The data is enormous in the present era because many measuring variables are required and the frequency is large. The database needs to be secured and should be available only to concerned personnel to protect the information from illegal use and security breaches.
The application part monitors and executes the air quality measurements and provides an interface for humans to interact with the analytics. It includes an algorithm that depends on a company’s requirements. The alerts notify the concerned persons in case of malfunction or deviation. The sensor readings are converted to a readable form by the software.
Hardware: Sensors and Filters
The hardware comprises measuring devices that measure air quality. It does so by measuring the concentration of different gases such as carbon dioxide, carbon monoxide, and particulate matter. The software processes the readings from these sensors for further analysis.
All the measuring devices and relevant hardware interfaces to the software part through the communication media.
Design Considerations for Personnel and Product safety
The air quality measurements indicate the pollution exposure of an area to its occupants. These measurements not only benefit humans but are also beneficial to the products, as poor air quality affects the product’s properties and lifetime.
Personnel Safety
Workers who spend most of their time inside the building are greatly affected by the building's environment. Measuring the air quality of a building helps detect unhealthy building parameters. Design parameters of a building for personnel safety include:
- Temperature Levels: Temperature levels are a handy source of information about an area. High or low temperature values indicate the problem at an early stage.
- Humidity Levels: Like temperature, the humidity levels are another firsthand indication of a problem in the air. Deviation from the set humidity levels are easily detected, and corrective actions are initiated.
- Carbon Dioxide Levels: Monitoring carbon dioxide levels in an environment provides information about the effectiveness of an area's ventilation, as higher carbon dioxide levels indicate lower levels of oxygen. Airflow systems use carbon dioxide levels to detect problems.
Ensuring Non-Contaminated End Products
The end-product refers to the final product packed in packaging material. Although the packaged product is less sensitive to the environment than the product at the manufacturing stage, the end-product also requires a controlled environment to prevent damage to its properties and packing. The following air quality parameters are helpful to prevent damage to the end-product:
- Temperature Levels: Higher temperature levels are a threat to the product at all stages, from manufacturing to packaging. Keeping the temperature in acceptable ranges is a fundamental requirement in all industries.
- Particulate Levels: Measuring particulate levels gives vital information on the filtration efficiency of an area. High particulate levels indicate poor filter’s efficiency. These values also indicate when to change the filters of an air supply or HAVC system. Particulate levels penetrate the packaging material and deposit on the product’s surface resulting in a decrease of market value