Facebook
 Google
 GitHub
 Linkedin
Deep Dive Into Fault Tree Analysis
After learning about the basic events and symbols found within a fault tree, let’s dive through a fault tree analysis (FTA) example, industries that use it, and some software.
A fault tree is a graphical representation of components and subsystems of a larger system. It maps the hierarchical and logical relationship between various components and can be used to analyze the potential avenues of system failure.
Fault tree analysis (FTA) can be used to build robust and resilient systems. We discussed the basics of FTA—its types, structure, and symbols—in the previous article. Here, let us take a look at how it functions with a simple example.
Fault Tree Analysis (FTA) Example
Consider a simple control system that controls the function of a motor control circuit that automatically cuts off the motor when the water tank is full. A potential system failure is an overflowing tank leading from the motor control system not working.
How to Create Fault Tree Analysis (FTA)
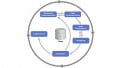
A simple fault tree for such a scenario is given below.

Figure 1. Fault tree diagram for simple motor control.
The top event is represented as T. We will analyze the fault tree for a failure event in which water is overflowing.
A, B, C, D, and E are the basic events. These events occur spontaneously and could be the root cause of the problem.
F and G are intermediate events. This means they are caused by logical interactions of some basic events or other intermediate events. The different logical relationships will lead to the potential failure—the top event, T.
Some numbers are given along with basic events. They represent the probability of the failures to occur. The basic events A, B, C, D, and E are failures of one or the other, and the probabilities are provided alongside them.
It is pretty clear from the image how the logical relationships between the various events function. Only if event A and event B occur, the intermediate even F will occur. But if event C or event D occurs, event G will occur.
The top event, T, is connected to other intermediate events and a basic event through an OR gate. This means if any of the one events among E, F, or G occur, the top event failure will occur.
How to Create Probability in Fault Tree Analysis (FTA)
The probabilities of each intermediate event and the top event can be calculated using the probabilities of the basic events provided.
P(F) = P(A AND B) = P(A) * P(B)
P(F) = 0.05 * 0.03
P(F) = 0.0015
Similarly, one can find the probability of the intermediate event G. Here, C and D are disjoint events.
P(G) = P(C OR D) = P(C) + P(D)
P(G) = 0.12 + 0.23 = 0.35

Figure 2. Fault tree reports are probability statistics are available in ALD. Image used courtesy of ALD
Once we find the probabilities of E, F, and G, we can calculate the probability of the top event occurring. Here, E, F, and G are also disjoint events.
P(T) = P(E) + P(F) + P(G)
P(T) = 0.02 + 0.0015 + 0.35
P(T) = 0.3715
The overall probability of a system failure occurring and tank overflowing is 37.15%. Using the fault tree and the probabilities for each event, we can analyze how to reduce the chance of failure.
Fault Tree Analysis (FTA) Findings
From the calculations above, we can see that the intermediate event G is the largest contributor to the chance of system failure. Reducing the probability of occurrence of G will significantly reduce the overall chance of the top event from occurring. From the fault tree, we can see that G is connected to the basic events C and D through an OR gate. To reduce the chance of occurrence for G, the probability of events C and D have to be reduced. This will, in turn, improve the reliability of the complete system.
Fault Tree Analysis (FTA): Example Industries
FTA can be used in any industry where there are complex interconnected systems. However, conducting FTA requires expertise, time, and some costs associated with it. Therefore, it is not a prudent investment for many industries to conduct FTA for every industry vertical.
In most instances, FTA is conducted in industries that are part of critical infrastructure. Such industries will be of national importance and could cause considerable disruptions to the smooth running of a country. For example, the chaos due to the recent oil pipeline disruptions was detrimental to the locality and country. Companies should complete FTA for such critical assets and infrastructure.
In addition to critical infrastructure, FTA can also be used in industries where the cost of failure is very high. In such cases, the time and cost associated with conducting FTA are minuscule compared to the cost of system failure. Here are some industries that use FTA to ensure the robustness of their systems.
- Defense
- Oil and gas
- Transportation systems like subway systems and monorail
- Aeronautical/space
- Shipping and navigation
- Industrial automation
- Biomedical equipment
- Pharmaceutical
- Water treatment plants
- Sewage systems
- Nuclear power plants
- Other power generation projects
The list of industries that could use FTA is not limited to the list above. It can be used in any industry where the cost of conducting FTA is negligent compared to the cost of failure.
Fault Tree Analysis (FTA): Software
FTA used to be done with pen and paper or other physical media. It used to be cumbersome to draw the fault tree of a large system on the limited real estate of paper. Transfer events were created to accommodate fault trees spread over multiple sheets. It also makes analyzing fault trees a difficult task.
After computers became widely utilized in industry, using software to draw fault trees is common. With interactive interfaces and ease of use, software is the preferred medium for conducting FTA.

Figure 3. An example diagram made in Visual Paradigm. Image used courtesy of Visual Paradigm
Visual Paradigm is a company dedicated to building various drawing tools for different industries. The company has dedicated software to conduct fault tree analysis, and its tool has an interactive and intuitive interface. The result of drawing the fault tree can be saved and stored in multiple formats. The added advantage is that it integrates well with other visual tools from the company.
All the functionalities required to conduct FTA is provided over the cloud by ALD Web Fault Tree Analysis. Another useful tool for the same purpose is Blockism from Reliasoft. FTA is a general-purpose tool that can be used across industries and processes. If the industry has a specific use case, one can make custom algorithms to accommodate its needs.
FTA is a powerful and effective technique to identify the potential faults of any system. But it takes significant time, effort, and expertise. Moreover, it has to be done for the infrastructure of national importance. It can also be done in sectors where the cost of failure is high. Nevertheless, FTA will identify the steps that companies can take to improve system reliability.