 Facebook
 Google
 GitHub
 Linkedin
Phasor Analysis of Transformer Circuits

Step-up, step-down, isolation, boost, and buck transformers can be analyzed with phasor diagrams
Phasor analysis is a useful tool for simplifying three phase waveform generation and distribution by representing voltage and current quantities in graphical form.
Three-phase AC is the dominant mode of electric power generation and distribution in modern societies. Analyzing voltages and currents in these systems can be quite complex, but phasor representation is a tool useful for simplifying that analysis by representing voltage and current quantities in graphical form. This section of the book illustrates the use of phasors as an analytical tool through examples. This section begins with single-phase phasor analysis and progresses to three-phase phasor analysis.
Phasor Analysis
Extensive use of an imaginary instrument I call the “phasometer” helps relate phasor arrow direction to real circuit connections. Suffice it to say, a “phasometer” is nothing more than a small synchronous AC motor with an arrow-shaped rotor, which when coupled with a strobe light set to flash whenever some reference voltage reaches its positive peak, graphically shows the relative phase of the measured quantity with respect to that reference voltage. In other words, a phasometer/strobe combination shows a “snapshot” view of the waveform’s position at that point in time when the reference wave it at its positive peak. This is precisely how phasors are drawn: arrows with angles displaced from 0\(^{o}\) by an amount proportional to the phase shift between that quantity and some reference waveform.
Here is what a triplet of phasometers would indicate if connected to a three-phase power bus, with phase A used as the reference and given an ABC phase sequence (also called “phase rotation”):
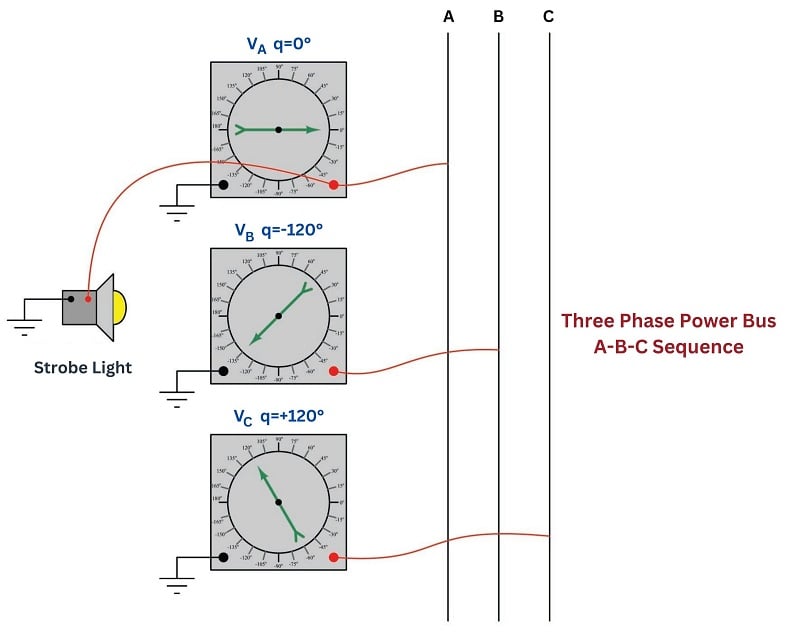
In an ABC phase sequence, phase B’s voltage lags behind phase A’s voltage by 120\(^{o}\), while phase C’s voltage leads ahead of phase A’s voltage by 120\(^{o}\) (or, one could say phase C lags a full 240\(^{o}\) behind phase A).
Phasors in Single Phase Transformer Circuits
Phasors are to AC circuit quantities as polarity is to DC circuit quantities, and for this reason they are particularly useful in analyzing transformer circuits because transformers by their very nature allow polarities to be mixed and matched.
In the “Basic principles” discussion of the “Transformers” section of this book, we used standard DC polarity marks (+ and \(-\)) to denote the polarity of voltage at an instant in time where the sinusoidal waves for each winding reached their peaks. Although it is often important to show the polarity of transformer windings relative to each other, the use of DC notation for this purpose can be misleading. An alternative symbology places a dot, or square, or some other distinguishing mark at one end of each transformer winding to show common polarity at any instant in time. The marked terminal of a transformer winding is called the “polarity” terminal, while the unmarked terminal is called the “nonpolarity” terminal:

The marks should be interpreted in terms of voltage polarity, not current. To illustrate using a “test circuit” feeding a momentary pulse of DC to a transformer:

If the battery polarity were reversed, the “polarity” (dot) terminal of each winding would be negative with respect to the “nonpolarity” terminal at the moment in time when the switch is pressed. That is to say, the “polarity” marks merely show which terminals will share the same instantaneous voltage polarity at any given point in time – not which terminal is always positive.
Phasor Representation of AC Waveforms
Consider these examples, where the polarity of a transformer’s secondary winding is changed to illustrate the effect on AC phase shift from primary to secondary. In the left-hand example, the “polarity” terminal of the transformer’s secondary winding exhibits a phase angle of 0\(^{o}\) (with respect to ground) at the same point in time when the primary winding’s voltage is at 0\(^{o}\): the two winding voltages are in-phase with each other. In the right-hand example, the secondary winding polarity has been reversed, the effect being a 180\(^{o}\) phase shift in voltage. A pair of phasometers in each example, both synchronized to the positive peak of the primary voltage, shows the phase relationships clearly:

A useful way to analyze phase shifts in transformer circuits is to sketch separate phasor diagrams for the primary and secondary windings, and use the polarity marks on each winding to reference each phasor’s position on the diagram. We begin this analysis by first sketching a phasor for any voltage of which the phase angle is given to us. Since transformer windings share common phase shift by virtue of those windings sharing the same magnetic field, the phasor representing the other winding’s voltage must possess the same angle. The only distinction is the length of each phasor (representing primary and secondary voltage magnitudes) and its origin (starting point on the diagram).
Applying this analysis to the in-phase transformer circuit example. We will regard the secondary winding’s voltage as a phasor that is half the length of the primary winding’s voltage given the 2:1 turns ratio, but oriented at the same angle:

The result is a pair of phasors both at 0\(^{o}\) angles. Note the placement of dots on each phasor to mark the relationship of the phasor to each winding polarity. The center of the diagram where the real and imaginary axes intersect is the point representing zero potential (ground). The length of each phasor tells us the magnitude of each waveform, in this case 120 volts and 60 volts AC, respectively. The “nonpolarity” end of each phasor line must be located at the origin because the nonpolarity terminal of each transformer winding is connected to ground.
Now consider the same analysis applied to the out-of-phase transformer circuit:

The result of this transformer connection is a pair of horizontal phasors, angled 180\(^{o}\) apart from each other. Note how the secondary phasor still has its polarity mark on the right-hand end, but now that end of the phasor is anchored at the diagram’s origin because now the “polarity” (dot) terminal of the transformer’s secondary winding is connected to ground. Following our rule of keeping primary and secondary phasors at equal angles, the only difference made by grounding the opposite terminal of the secondary winding is the reference point of the secondary phasor. The secondary phasor must remain locked at the same angle as the primary phasor, but its position on the diagram is determined by where the transformer winding connects to ground.
The following analyses illustrate the relationships between phase angles, transformer polarity, circuit connections, and phasor diagrams.
Here we have an “autotransformer” connected to boost the primary voltage. The \(V_P\) and \(V_S\) phasors representing voltage across the primary and secondary windings must have common angles (i.e. both horizontal phasors), but the secondary phasor is “stacked” on the end of the primary phasor to create a longer phasor representing the voltage \(V_{out}\) with reference to ground. We can tell the phasors will be stacked polarity-end-to-nonpolarity-end because that is how the two transformer windings are electrically connected to each other:
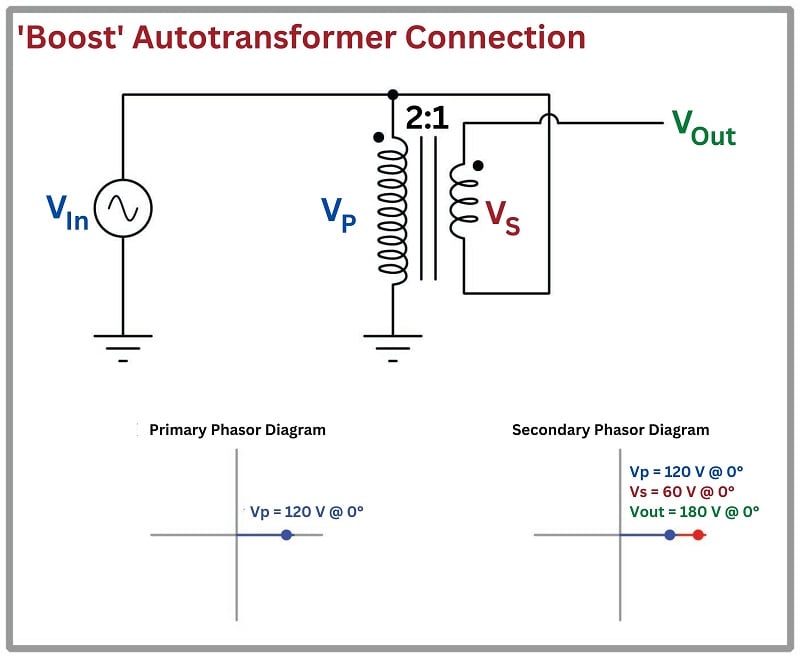
The result of this “boost’ configuration is an output voltage that is the direct sum of the primary and secondary winding voltages: 180 volts with a 2:1 transformer ratio and 120 volt source. If the transformer ratio were 4:1 instead of 2:1, the output would be 150 volts (120 volts + \(120 \over 4\) volts).
Here we have another autotransformer, this time connected to buck the primary voltage. The \(V_P\) and \(V_S\) phasors still share common angles, but now they are “stacked” differently: polarity-end-to-polarity-end. This is challenging to see on the second phasor diagram because the \(V_P\) and \(V_S\) overlap each other, sharing a common “polarity” (dot) end point:
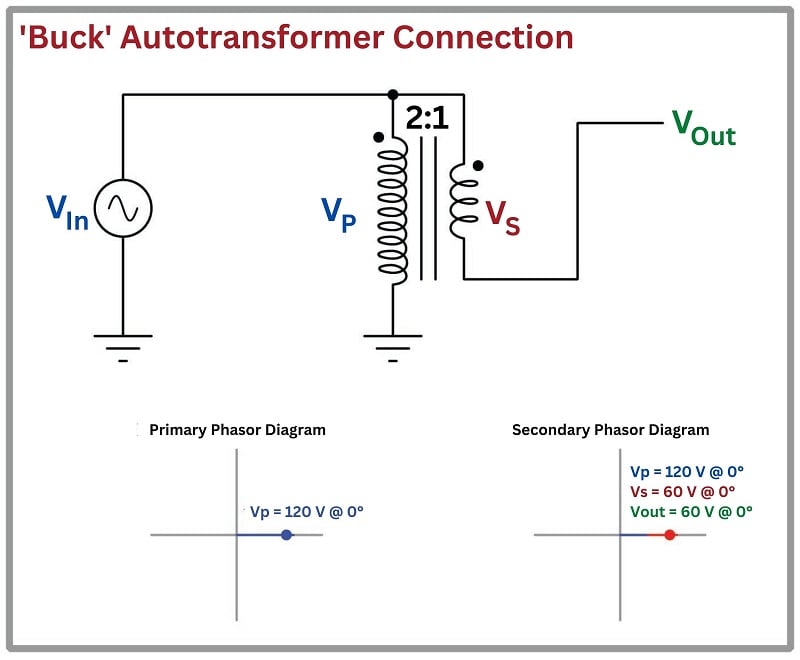
The result of this “buck” configuration is a \(V_{out}\) that is the difference between \(V_P\) and \(V_S\) rather than being the sum of the two as was the case with the “boost” configuration. If the transformer ratio were 4:1 instead of 2:1, the output of this buck autotransformer would be 90 volts (120 volts \(-\) \(120 \over 4\) volts).
Phasors in Three Phase Transformer Circuits
In the following three-phase transformer circuit, each transformer has been labeled with a number, and each pair of phasors representing primary and secondary winding voltages for each transformer has that same identifying number written next to it for convenient reference. Numbering the phasors makes it clear which phasor(s) belong to which transformer.
As usual, the primary and secondary phasors for each transformer share the same angle, but the secondary phasors are “stacked” polarity-end-to-nonpolarity-end because that is precisely how the secondary windings are electrically connected to each other. Assuming an ABC phase sequence with \(V_A\) being the reference phasor defining 0\(^{o}\) phase angle:

REVIEW:
-
Polarity in transformer wiring determines the angle of a phasor (phase angle) from primary to secondary.
-
Three phase transformers are represented with a phasor diagram for each transformer coil.
-
Boost and buck converters are analyzed with phasors to illustrate the respective increase or decrease in output voltage.
