 Facebook
 Google
 GitHub
 Linkedin
Process Flow Diagrams
To show a practical process example, let’s examine three diagrams for a compressor control system, beginning with a Process Flow Diagram, or PFD. In this fictitious process, water is being evaporated from a process solution under partial vacuum (provided by the compressor). The compressor then transports the vapors to a “knockout drum” where they condense into liquid form. As a typical PFD, this diagram shows the major interconnections of process vessels and equipment, but omits details such as instrument signal lines and auxiliary instruments:
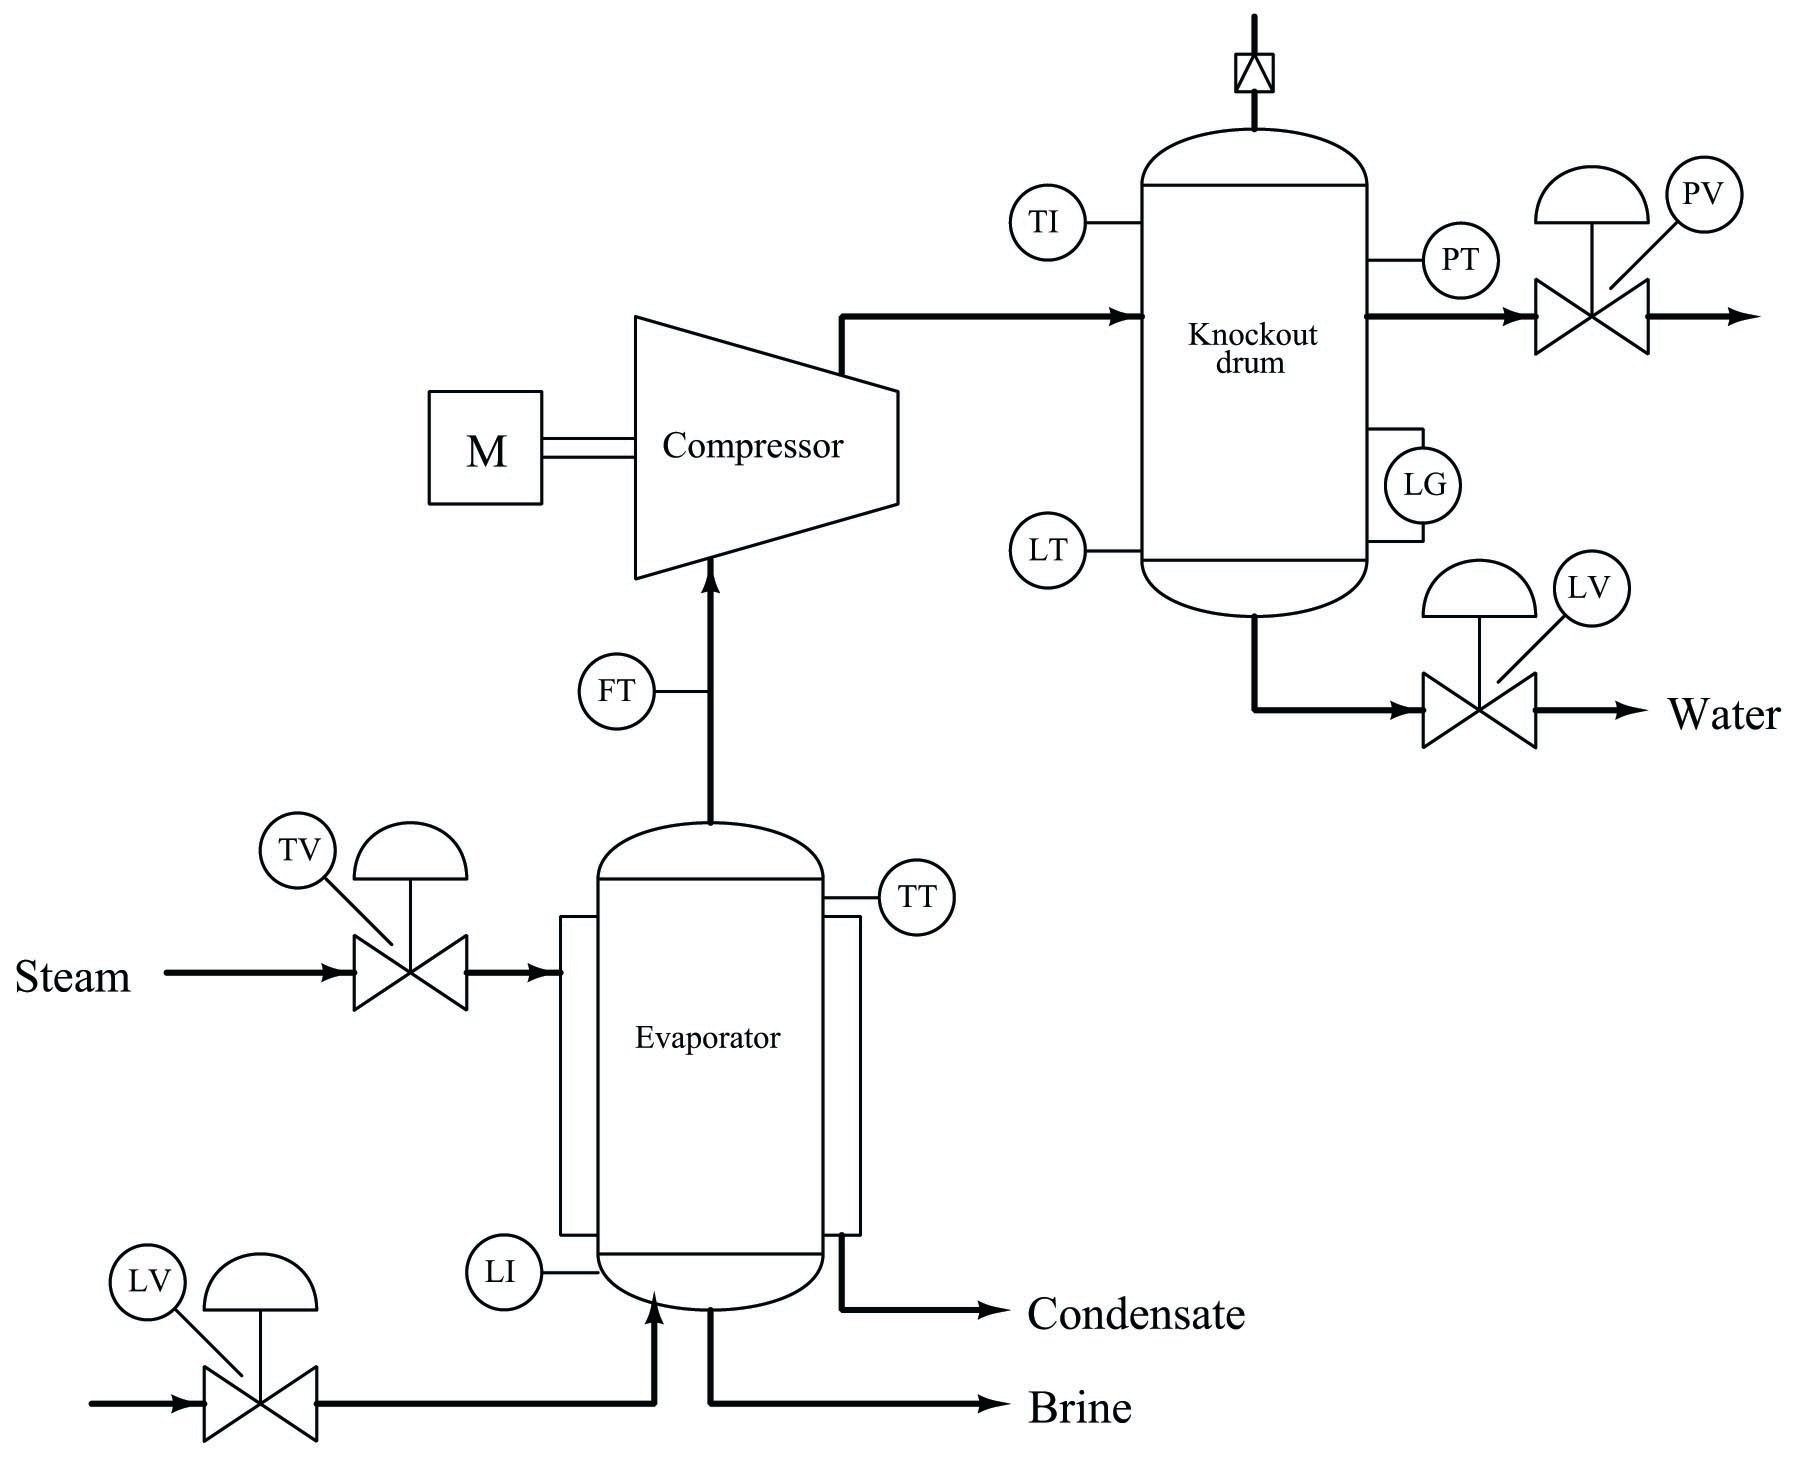
One might guess the instrument interconnections based on the instruments’ labels. For instance, a good guess would be that the level transmitter (LT) on the bottom of the knockout drum might send the signal that eventually controls the level valve (LV) on the bottom of that same vessel. One might also guess that the temperature transmitter (TT) on the top of the evaporator might be part of the temperature control system that lets steam into the heating jacket of that vessel.
Based on this diagram alone, one would be hard-pressed to determine what control system, if any, controls the compressor itself. All the PFD shows relating directly to the compressor is a flow transmitter (FT) on the suction line. This level of uncertainty is perfectly acceptable for a PFD, because its purpose is merely to show the general flow of the process itself, and only a bare minimum of control instrumentation.

This is great…