Facebook
 Google
 GitHub
 Linkedin
J
I'll give a short background on what I'm doing then I'll get to the question.
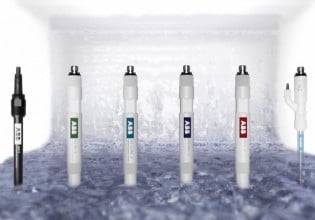
I'm currently writing my thesis on the subject of quality assurance of water consumption data. The data I'm working with is the hourly average (l/s) water consumption for different areas in a city, the population within the areas vary from 100 - 20000 people. For the smaller areas the consumption is assumed to be what has been measured with electromagnetic flowmeters at the pump station connected to the area, while in the larger areas the consumption is assumed to be Inflow (from other areas)-Outflow (to other areas) -Reservoir. All measurements are done with electromagnetic flowmeters (Brands include ABB, Siemens & Endress Hauser)
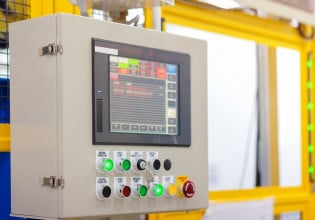
Part of the thesis work revolves around looking at different factors that can be a source of error in the data. I've contacted producers and scanned the web looking for references and so far I've understood that installation effects can be a major source of error at least when it comes to the meters. However the data comes from an SCADA system so I suppose there are other factors that can contribute to errors in the data.( faulty PLC? Data transmission? Data handling?)
And this is were I can't find anymore information on the web, and also the reason I'm posting here. What could other sources of error be? While working with the data I've found some "errors" that show up every now and then and I can not find an explanation for why they occur.
I'll post a link with two examples (don't know if it is possible to attach pictures here)
Explanation to the figures. Flow (l/s) on the y-axis and hour on the x-axis. One can se a pattern in the data, one peak in the morning and then usually one in the afternoon.
In the first figure there is an example of a reoccurring "error", values are repeated for some time then they are followed by a peak (in some cases the peak value - sum of repeated values). In the other figure values are repeated but there isn't the same type of peak following the repeated values.
I've been trying to find examples of types of errors that can arise from flow measurement but I haven't found any.
Does anyone have any ideas why the data looks this way? Also what could other sources of error be except the flowmeter itself?
I'm currently writing my thesis on the subject of quality assurance of water consumption data. The data I'm working with is the hourly average (l/s) water consumption for different areas in a city, the population within the areas vary from 100 - 20000 people. For the smaller areas the consumption is assumed to be what has been measured with electromagnetic flowmeters at the pump station connected to the area, while in the larger areas the consumption is assumed to be Inflow (from other areas)-Outflow (to other areas) -Reservoir. All measurements are done with electromagnetic flowmeters (Brands include ABB, Siemens & Endress Hauser)
Part of the thesis work revolves around looking at different factors that can be a source of error in the data. I've contacted producers and scanned the web looking for references and so far I've understood that installation effects can be a major source of error at least when it comes to the meters. However the data comes from an SCADA system so I suppose there are other factors that can contribute to errors in the data.( faulty PLC? Data transmission? Data handling?)
And this is were I can't find anymore information on the web, and also the reason I'm posting here. What could other sources of error be? While working with the data I've found some "errors" that show up every now and then and I can not find an explanation for why they occur.
I'll post a link with two examples (don't know if it is possible to attach pictures here)
Explanation to the figures. Flow (l/s) on the y-axis and hour on the x-axis. One can se a pattern in the data, one peak in the morning and then usually one in the afternoon.
In the first figure there is an example of a reoccurring "error", values are repeated for some time then they are followed by a peak (in some cases the peak value - sum of repeated values). In the other figure values are repeated but there isn't the same type of peak following the repeated values.
I've been trying to find examples of types of errors that can arise from flow measurement but I haven't found any.
Does anyone have any ideas why the data looks this way? Also what could other sources of error be except the flowmeter itself?