Facebook
 Google
 GitHub
 Linkedin
Industrial Connectivity and DataOps: Work Together to Unlock Your Manufacturing Data
Working with data is no simple task. It requires a solid understanding of how to acquire the data, process it, and then use it to deliver tangible benefits to the operation and the company.
Manufacturing data is trapped. It sits locked inside hundreds of different machines—PLCs controlling assembly lines, CNC machines cutting parts, sensors monitoring temperatures—each speaking its own language. Getting that data out, making sense of it, and using it to improve operations has been one of the biggest challenges in modern manufacturing.
This article explains how two types of industrial software work together to solve this problem: connectivity platforms (like Kepware) that collect data from machines, and DataOps platforms (like HighByte) that organize and prepare that data for business use.
The Problem: Why Is Manufacturing Data So Hard to Use?
Walk onto any factory floor, and you'll probably find equipment from different manufacturers, installed over several decades. A Siemens PLC from 2010 sits next to an Allen-Bradley controller from 2018 and a legacy machine with a Modbus connection from 2005. Each uses different protocols and data formats.
When engineers need to use this production data for a dashboard or quality analysis, they face three major challenges.
Challenge 1: Extracting the Data
Each machine requires specific technical knowledge to connect. You need to understand Siemens S7 protocol, Allen-Bradley Ethernet/IP, Modbus TCP, and dozens more. A single production line might require expertise in 5-10 different protocols.
Challenge 2: Making Sense of the Data
Even after connecting, the raw data is cryptic. A temperature sensor might report "40961" without units or context. Is that 40,961°F? A register value? Without understanding how each device structures its data, these numbers are meaningless.
Challenge 3: Preparing the Data for Analysis
Your business systems—dashboards, analytics platforms, AI tools—expect organized, contextualized information. They do not care that “Register 1045 = 450” or “Register 2031 = 9.” Instead, they need to know “Machine A produced 450 parts with 2% scrap rate.”
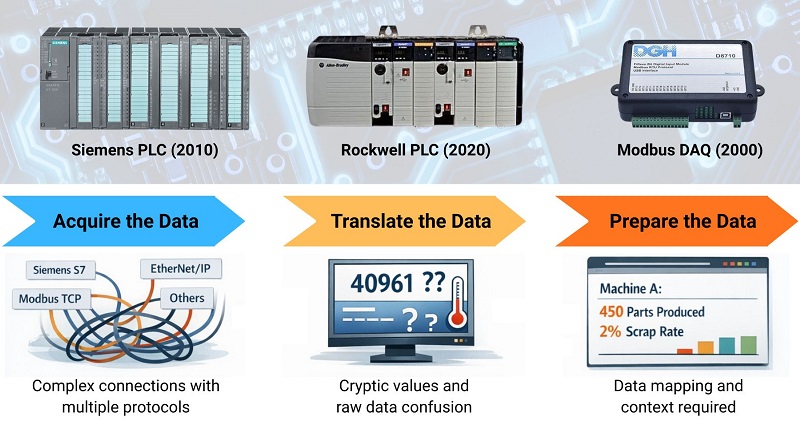
Figure 1. The challenge of manufacturing data is converting from collection to useful analysis.
The Solution: Harmonizing Two Specialized Systems
The most effective approach uses two specialized platforms working together, each handling what it does best.
Connectivity platforms focus on one job: reliably collecting data from every type of industrial equipment and delivering it in a standardized format. Think of this as translation—converting dozens of machine languages into one common language.
DataOps platforms take that standardized data and add meaning. They organize raw signals into useful information (like production counts and quality metrics), apply business context (machine names, locations, product types), and deliver formatted data wherever you need it—cloud analytics, dashboards, or AI systems.
Let’s compare two common industry platforms that serve these two tasks.
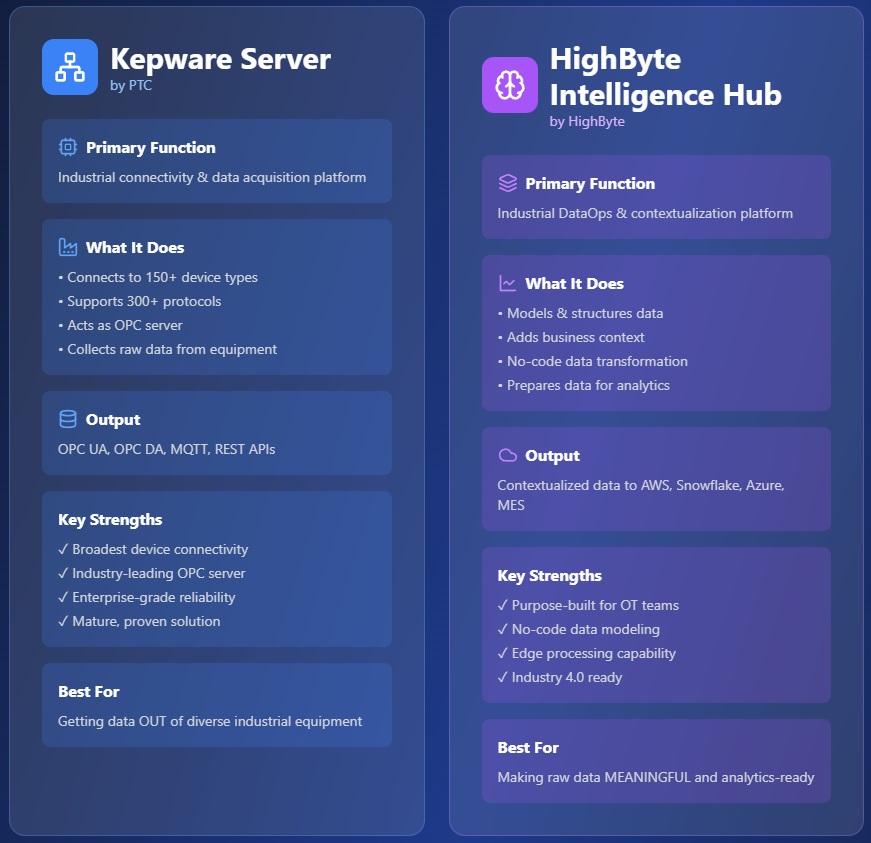
Figure 2. Comparison of the kepware and HighByte.
Kepware Solves the Connectivity Challenge
Kepware specializes in connecting to industrial equipment.
Pre-built drivers eliminate custom programming
Instead of writing code to communicate with each machine type, you select from 150+ pre-built drivers. Need to connect to a Siemens S7-1200 PLC? There's a driver. Allen-Bradley ControlLogix? There’s a driver. Modbus, FANUC, Mitsubishi, Omron—all covered. This turns weeks of programming into mere hours of configuration.
Centralized management across multiple facilities
In a multi-plant operation, managing connections to thousands of machines becomes overwhelming. Kepware’s cloud-based control panel lets you configure, update, and monitor all your connections from one place—whether you have one small shop floor or 5,000 machines spread across 50 sites. When you need to update security settings or add new connections, you do it once rather than traveling to each location.
Standardized output formats
All those different machine protocols get converted to industry-standard formats: OPC UA (the modern industrial connectivity standard) and MQTT (popular for cloud applications). Your downstream systems only need to understand these two protocols instead of dozens.
HighByte Adds Context and Organization
Raw machine data alone doesn’t tell you much. HighByte transforms that data into actionable information.
Building reusable templates for similar equipment
When you have 20 identical machines, you shouldn’t have to configure data 20 different times. HighByte lets you create a template—defining what data matters, how to calculate metrics like cycle time or throughput, and what context to add—then apply it across all similar equipment. Change the template, and all 20 machines update automatically.
Adding business context automatically
HighByte enriches technical data with business meaning. A sensor reading becomes “Temperature on Line 3, Building A reached 185°F at 2:45 PM during production of Part #X1234.” This context makes data immediately useful for operators, engineers, and business analysts who don’t speak in register numbers and protocol addresses.
Calculating meaningful metrics at the source
Rather than sending millions of raw data points to the cloud and calculating metrics there (expensive and slow), HighByte processes data at the edge. It calculates production counts, identifies downtime, computes OEE (Overall Equipment Effectiveness), and only sends the results. This dramatically reduces data costs and makes information available instantly.
Managing data quality and governance
HighByte tracks what data came from where, applies validation rules, handles missing or bad data gracefully, and maintains version control. When someone questions a production report six months later, you can trace exactly how that number was calculated.
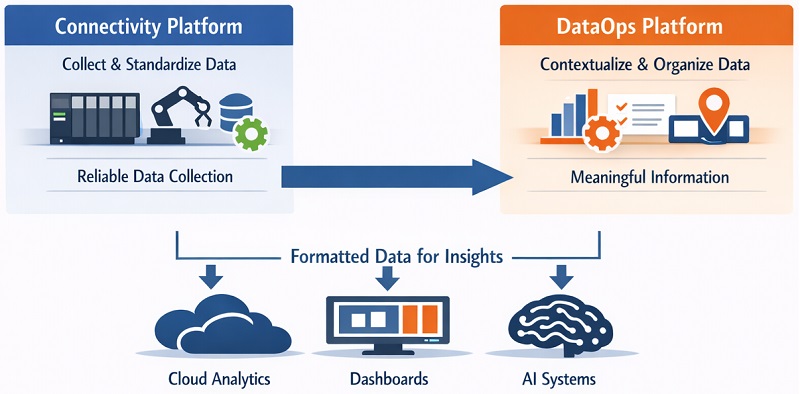
Figure 3. Dividing responsibilities between connectivity and operational usefulness.
How They Work Together: A Practical Example
Let’s walk through a real-world scenario: monitoring production quality across a packaging line.
Step 1: Kepware collects the raw data
Kepware connects to five different machines on your packaging line: a filling machine (Siemens PLC), a capping machine (Allen-Bradley PLC), a labeler (Modbus device), a weight checker (proprietary serial protocol), and a vision inspection system (OPC UA). Each connection is configured through Kepware's interface in minutes using pre-built drivers.
Step 2: Kepware standardizes and delivers
All five data streams get converted to OPC UA and published on your network. Now everything speaks the same language and follows the same data structure.
Step 3: HighByte adds meaning
HighByte reads the OPC UA data and applies your packaging line model. It knows that register 1045 is “number of units filled,” and register 2031 is “number of rejects.” It combines data from all five machines, adds context (line number, product SKU, shift), calculates quality metrics, and detects when reject rates exceed thresholds.
Step 4: HighByte delivers analytics-ready data
Instead of sending millions of raw data points, HighByte sends structured messages like: “Line 3 completed 15,243 units of Product SKU-789 during Shift 2, with 1.2% reject rate (183 units), primarily at the capping station.” This formatted data flows to your dashboard, quality database, or cloud analytics platform—ready for use right away.
Step 5: Continuous monitoring and management
Kepware’s central management console shows all five machine connections are healthy. HighByte’s monitoring shows data flowing correctly through each processing step. When you replicate this line setup to three other facilities next quarter, you copy the existing configuration rather than starting over.
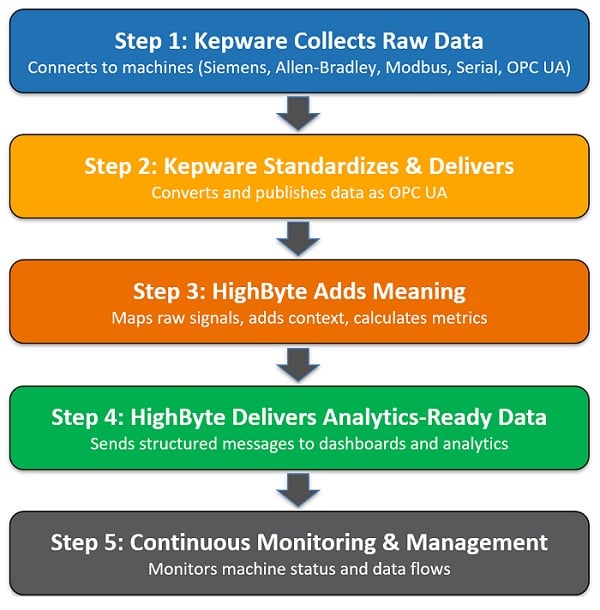
Figure 4. The flowchart of data usefulness.
Why Does This Collaboration Matter?
You might wonder why we don’t use one system for everything? The answer lies in specialization and scale.
Kepware focuses on the hard connectivity problem: Supporting 150+ industrial protocols requires deep expertise in how each manufacturer's equipment works. Keeping drivers updated as vendors release new firmware versions is a full-time commitment. Managing secure connections to thousands of machines across multiple sites requires enterprise-grade infrastructure. Kepware meets these challenges.
HighByte focuses on the data value problem: Modeling industrial processes, building reusable templates, calculating metrics efficiently, governing data quality, and integrating with modern analytics platforms requires different expertise. HighByte is making raw data useful.
When you separate these concerns, you get best-in-class capabilities for both. You also gain flexibility—if a new analytics platform emerges, you swap out one component without rebuilding your entire data infrastructure.
Step‑by‑Step Playbook
Most organizations start small and expand, so it’s important to have a clear path from ideation to full implementation.
Phase 1 (1-2 months): Pilot on one production line
Deploy Kepware to connect to machines on a single line. Set up HighByte to model one critical use case—perhaps overall equipment effectiveness (OEE) or quality tracking. Prove the concept works and delivers value before expanding.
Phase 2 (2-3 months): Expand to the full site
Apply your tested models to additional lines in the same facility. You'll move faster now because templates are built and teams understand the process.
Phase 3 (3-6 months): Roll out to additional facilities
With proven templates and configurations, deploying to new sites becomes faster—often just weeks. Kepware's central management makes it practical to operate at scale.
Phase 4 (ongoing): Advanced capabilities
Once the foundation is solid, add capabilities like automated data quality checks, predictive maintenance models, or AI-powered insights. The hard infrastructure work is done.
The Practical Benefits
Organizations using this approach typically see:
- Faster time to insights: Days instead of months to get production data flowing to analytics tools
- Lower costs: No custom programming for each machine type; reduced cloud data transfer costs
- Better data quality: Consistent, governed data instead of ad-hoc spreadsheets and manual processes
- Future flexibility: As technology evolves, you upgrade components without rebuilding everything
Conclusion
Manufacturing data should drive better decisions, not create headaches. By using specialized platforms that work together—one handling connectivity, one handling data organization—you build a foundation that's both powerful and practical.
You get out from under the burden of custom programming for each machine. You turn raw signals into business insights. And you create infrastructure that scales as your operation grows.
The result is simple: your data becomes an asset that drives improvement, rather than a technical challenge that consumes resources.
All images used courtesy of the author