Facebook
 Google
 GitHub
 Linkedin
A Hands-On Demonstration of the PyGWalker Data Visualization Library - Part 1
PyGWalker is an open-source data visualization tool for developing dashboards and analytics. To get you started down the right path here's a hands-on guide on how to use PyGWalker to visualize a pseudo-milling dataset.
Working at a mid- or large-capital company that makes things, it’s likely you are aware there are mountains of untapped company data that could be put to good use. In this scenario, Excel sheets and SQL database tables litter the landscape, with critical business insights lost among them because it still can be difficult to extract the data and analyze it quickly and accurately. Considering your surroundings, this is where data visualization or business intelligence software is contributing to better data management and business process development.
What Exactly Is Data Visualization?
As a technology, PyGWalker rests in the data visualization and business intelligence tools “pen.” Two other tools in the barnyard are Microsoft’s Power BI and Tableau. Regardless, these digital tools are essential to creating interactive data dashboards, as well as to summarize and extract meaning from the numerous datasets that often exist in the corporate world.
The popularity and success of these giants stem from two key attributes. The first is the “low-code” environment and slick user interface (UI). A data manager who is well-versed in domain-specific knowledge can quickly and effectively deliver a dashboard that provides information and decision support much faster than traditional applications. The second attribute is the ease of deployment and the ability to share the dashboard with other team members. A great example of this is Tableau Server, where employees can publish dashboards internally or publicly with the click of a few buttons.
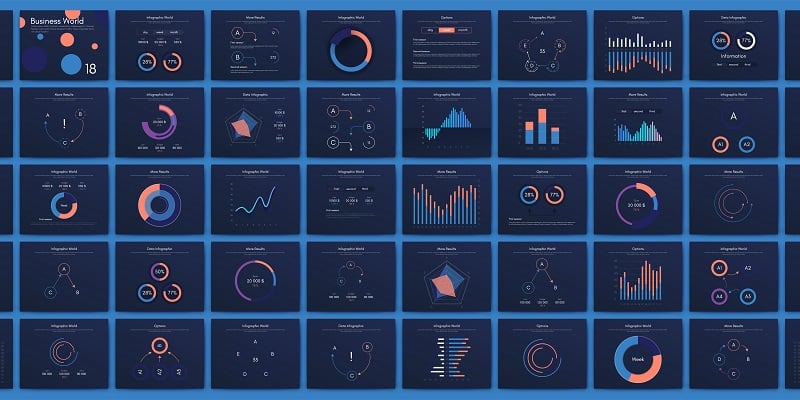
There are mountains of untapped data out there. PygWalker can help you visualize it. Image used courtesy of Adobe Stock
Why the Funny Name PyGWalker?
An amalgamation of technologies, PyGWalker is pronounced the way it's spelled. The open-source documentation describes the tool as "Python binding of Graphic Walker" because the tool combines Python’s Jupyter Notebook environment with Graphic Walker, a typescript-based open-source take on Tableau. According to tool developer Kanaries, developers named it PygWalker just for fun. The goal of PygWalker is not to compete with the business intelligence titans like Tableau. It’s rather a tool that allows data scientists and analysts to perform exploratory data analysis and build visualizations faster within a Jupyter Notebook environments.
A Perfect Use-Case
In an earlier tutorial, I demonstrated a more traditional take on exploratory data analysis of a pseudo-milling dataset. One takeaway was that visualizations, as well as exploring the dataset involved lots of manual code that took extra time to extract, piece by piece, the value from a given dataset. However, using PyGWalker to visualize the pseudo-milling dataset, is a great example of the benefits of building its data-dashboarding tools. So let’s get the Pyg on the leash and take it for a walk!
Installation
In this example, we will be using a Google Colab notebook to support a seamless hardware setup. The notebook is an interactive programming environment that can be shared easily amongst engineers and other data-driven professionals. These notebooks serve as a great way to perform ad-hoc data analysis while also providing an avenue for traditional control engineers to broaden their programming skills.
Start by downloading the pseudo-milling machine dataset from Kaggle.com. This is a CSV file, but in order to use it for the project, it will need to be re-uploaded into the Colab workspace, using the file upload button on the left sidebar as shown below:

Next, let's install the PygWalker library to the runtime instance image powering the Google Colab workspace. This is a simple kernel command and execution as follows:
!pip install pygwalker
Initializing Dashboard
The following lines of Python notebook code in a kernel will generate the UI of the graphic walker dashboard:
import pandas as pd
import pygwalker as pyg
df = pd.read_csv('/content/ai4i2020.csv')
gwalker = pyg.walk(df)
Some basic UI buttons can get rough charts of data presented relatively quickly. Upon startup, data is aggregated by default. To turn off aggregation and see raw data points, you can select the cube circled in red:

The unique identifier of the data set rows is the “UDI” field. We can drag that field from the “Field List” column to the x-axis and drag a numerical field, such as “Process temperature [K]” to the y-axis field. The final resting place of the attributes is highlighted in the image below. The UI is remarkably similar to Tableau and this operation should feel very familiar to readers who have used Tableau. A scatter plot of the individual data collection points is generated below:

We can change the type of chart using the orange square button below. We will leave the graph in “Auto” for now:

Lastly, the size of the graph is quite small for the window. To adjust the graph size select “Fixed” from the sizing button:

Then drag the blue outline bordering the graph to expand:

Wrap Up
The preceding steps demonstrate how quickly simple graphs can be created from pygWalker. The next article will take a slightly deeper dive using this dataset to show some of the more advanced capabilities the tool has to offer.