 Facebook
 Google
 GitHub
 Linkedin
Control System Process Data Archiving: Strategy and Methodology
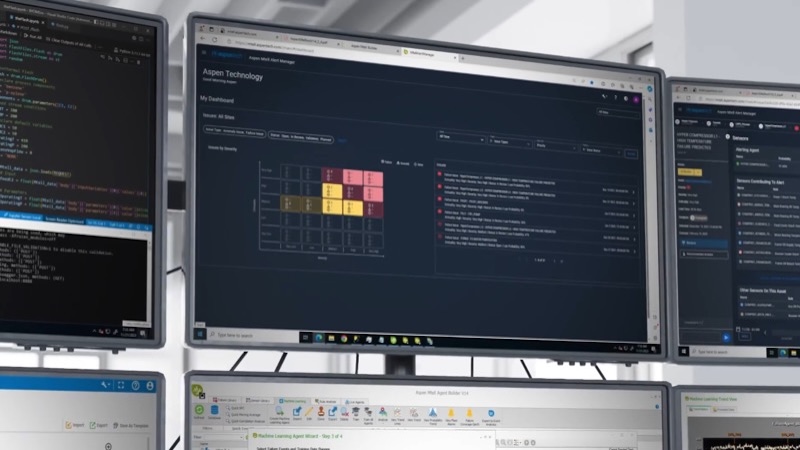
Data stored in a historian server is useful for analysis and troubleshooting. Learn about data archiving techniques for control systems, as well as what type of data is stored and the tools to make it happen.
Real-time process data in the EMS/DMS/SCADA system is stored in the relational database and only holds the current values of the measurement and status of the object. Therefore, it has no knowledge of process history. Historical data stored in the archiving/historian server can be viewed by reports, trends/curves, and single-line diagrams using the operator workstation.

Figure 1. Data stored in the historian server can be viewed later for analysis and troubleshooting. Image used courtesy of Canva
Any change in the current, voltage of the generator, and/or transformer winding oil temperatures is sent to the SCADA/DCS system and consequently stored in the primary database. The data is then fetched by the application and made available to the operator in the form of a single-line diagram or in tabular form.
When the updated value is stored in the online database, it automatically triggers a sampling for storage in the historical server.
In the database, tables are objects that hold process and field signal data (analog and digital). The historian server is sometimes called an archiving server or utility data warehouse (UDW) and contains multiple tables to store information about the power plant's real-world objects like transformers, busbars, breakers, pumps, motors, etc.
When the historical server discovers the changes in the online database, the archiving server reads the data and inserts it into the database automatically. Data stored in the historian server can be viewed later for analysis and troubleshooting using historian trends, event lists, spreadsheet-based reports, or by using web-based reports.
What is a Database Management System (DBMS)?
The purpose of a DBMS is to allow the orderly handling of all data in a software system, and it is used in all major industrial process control applications. The main objective and advantage of DBMS is that it allows the separation of data and application programs, therefore, it is possible to do database development and application development independently of each other.
The general requirements for a DBMS are the same as for a process control system in all well-known process control applications. There are three main terms to understand the storage structure and how the process value/status is archived.
Concept
All the information and data belonging to an object can be stored in one or more files or tables, where the file/table is related to the storing of data on primary and secondary memory.
Property
The information related to an object is further broken down into smaller units called properties or attributes or columns in the table. The property is the smallest amount of data that can be read from or stored in the database. An example of a property may be the current state of the circuit breaker (open or closed).
Instance
When the objects and the properties are defined, actual data can be entered into the database. For example, one circuit breaker forms one instance of the object (sometimes called ‘concept’) and we call this an indication. There are usually two types of properties for storing fixed and variable information.
Fixed data is not changed during the normal operation (for example, texts used in the dropdown list). Such information is entered once when the database is built.
Variable information properties are not initiated when the database is built but will get their values during the operation, normally in response to changing conditions of the process. An example of a variable property is the actual status (open/close) of a circuit breaker, wicket gate position (in %), and excitation current.
|
Object (Concept) |
Example Property Names |
|
Measured values |
Current value Alarm limits Dead-bands Scale factor Station reference Text External identity Engineering unit RTU no Block no in telegram |
|
Indications |
Current value Status flags Station reference Text External identity Command telegram Check-back telegram ON-command OFF-command RTU no Block no in telegram |
|
Displays |
Static part of picture Dynamic part (DPTs) Selection codes |
|
System Cross Reference |
External identity for objects File no Record no |
Table 1. Example Property Names for real-world objects.
What are Object Types?
An object type is one of the central and basic concepts of any UDW. An object type stores time tagged of one process value like measurement, indications, etc. with the same time resolution. The main common object types are:
-
Measurement means analog value (voltage, ampere, RPM, position, limits, etc.)
-
Indications for status (YES/NO, OPEN/CLOSE, START/STOP)
-
Accumulators (MWH, MVARH)
It is important to remember that process data of the same type with the same time resolution is stored in one object type (measure and/or indications) and one object type is stored in one database table.
Sampling and Inserting Process: Overview
In order to get a basic understanding of how online data is stored in the historical database, let's first understand the process value life cycle:
-
Data collection from the process to the primary database, which is often running in SCADA or application servers
-
Data is stored in the online database, viewable to an operator via GUI displays
-
Data is sampled to temporarily buffer tables with timestamp added
-
Data is inserted into the Oracle/SQL database in the archiving server
-
After some time, data is exported to a filesystem or external storage

Figure 2. Data archiving implementation steps from process to external storage media.
Examples of data that can be sampled from SCADA/EMS/DMS systems include telemetered digital and analog, calculated values, AGC set points, unit response, regulation, statistics of the system server’s availability, and events and alarms of the system.
Presenting Historical Process Data
The historical process data can be located either in the main/historian database, in the file system as text files, or on secondary media like magnetic tapes. Once the database is populated, there are many ways and tools to present data to the operator.
As per Figure 2 below, when historical data is sampled, it is saved to the main database for a specific amount of time, often called the retention period (one day, one month, etc). When the retention period expires, the data is optionally exported to the file system as a text file. The exported historical data can be stored in the file system or written to external storage media like tapes. These could later be imported to restore back the database area.

Figure 3. Trend XY curve example for AC generator-6 red phase current in kA.
The information in the historian server can be retrieved from different clients and with various tools with several commercial tools like browsers, reporting tools, and spreadsheet tools. It is also possible to create charts of different kinds (pie charts, bar charts, etc.) based on the retrieved data.
Calculating Total Plant Generation
There are two types of calculations called column and row or snapshot calculation. Row calculations calculate the results for the values of many objects within the same point in time.
This example of row calculation is used to determine the total generation of a plant (MW or MVAR). For snapshots, the calculation might use something like Matlab as a calculation engine, a third-party software enabling advanced calculations. The result of the row calculation can be stored in the non-process object created only for storing the result. Matlab supports complex formulas and support, but in this example, we describe only a simple calculation, i.e Total Plant Generation = G1 + G2 + G3.
|
Time |
Generator 1 MW |
Generator 2 MW |
Generator 3 MW |
Total Plant MW |
|
11.30 |
100 |
105 |
106 |
311 |
|
11.31 |
103 |
100 |
106 |
309 |
|
11.32 |
99 |
100 |
105 |
304 |
Table 2. Row calculation produces the total plant MW result value for three generators.
In real-time systems, we often need another type of data called calculated historical data. It has been observed that high-time resolution is not always needed for analysis. The data can be refined by calculating the maximum (MAX), minimum (MIN), and average (AVR) with a lower time resolution. Minimum and maximum calculations can be specified for sampled and calculated data as well.
Example of Retention Period Calculation
The retention period is the amount of time the data is stored in the database or how long time data can be stored in the Database Management System (DBMS like Oracle, MS SQL Server, PostgreSQL).
The first case scenario is to store 100 measurand objects for 1 day with a sampling frequency of 1 second in the database.
Parameters:
Sample Frequency = 1 second
No. of Objects Measured: 100
= 100 (objects) x 1 (day) x 24 (hours) x 60 (minutes) x 60 (seconds)
= 8,640,000
= 8.6 million rows for 100 objects in 1 day saved in DBMS with a time resolution of 1 second
The second example is to save process data in an archiving server with a resolution of 1 minute for 100 objects for a period of 60 days.
Sample Frequency = 1 minute
No. of Objects Measured: 100
= 100 (objects) x 60 (days) x 24 (hours) x 60 (minutes)
= 8,640,000
= 8.6 million rows for 100 objects saved in DBMS with a retention period of 60 days having a time resolution of 1 minute


Hello eng.munir
I appreciate your support and proficient experince with abb scada system where i have a problem after make switching over between udw1 and udw2 there is error appeared on event control alarms “ udw error in in the inserter “ that cause only the event list table not updated since two weeks “ only event list table” while the other table updated like measurements and accumulator, i appreciated your support to solve this problem .
for contact
My email : .(JavaScript must be enabled to view this email address)
Regards