Facebook
 Google
 GitHub
 Linkedin
Exploring 4 Popular Machine Learning Algorithms for Industrial Applications
Machine learning is a subset of AI that allows a machine to learn using past data. Learn about the two categories of machine learning as well as four major machine learning models often used in industrial applications.
Years ago, when we heard of artificial intelligence (AI), we often associated it with academic research or NASA technology. But today, AI is tightly integrated into our daily lives, sometimes even without us realizing their existences.
When we wake up in the morning and unlock our phones by using Apple’s FaceID, AI uses algorithms to compare our faces with what it stored (facial recognition). When we are ready for breakfast, the house is already cooling down with the home’s smart thermostat. Food will never run out because of the smart refrigerator. AI is used to learn about our personal preferences and habits to adjust the room temperature and prepare for our grocery shopping list (adaptive learning).
When we drive to work, Google Maps gives us the fastest route and monitors the real-time traffic (neural network). After a day of work, we can talk to Alexa (speech recognition) and ask for a recommendation for a movie. Netflix then starts streaming based on our past viewing history (decision trees). Without a doubt, AI is embedded in our daily lives.
Machine Learning - Supervised vs Unsupervised
Machine learning is a subset of AI that allows a machine to automatically learn using past data without the need to use complex mathematics or program in every scenario. There are two categories of machine learning, supervised learning and unsupervised learning. Let’s first take a look at the difference between them.
Supervised Machine Learning
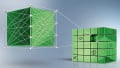
Supervised learning is a method that is defined by the use of labeled datasets. A labeled dataset simply adds a meaningful label to a set of data. Figure 1 is an example of a labeled dataset.
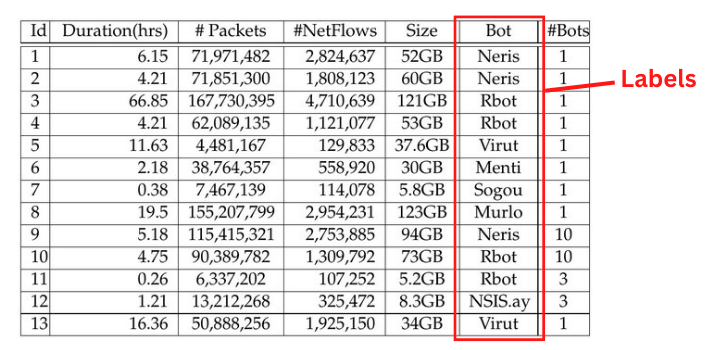
Figure 1. Labeled Dataset. Image adapted and used courtesy of Garcia et al.
The datasets are then used to train the algorithm into classifying the data or making predictions. This method can learn and get better over time to increase its accuracy. Supervised learning is good at classifying data and regression. For example, it can classify and block spam or robocalls from calling. A regression model is commonly used to predict a continuous value such as predicting house prices.
Unsupervised Machine Learning
On the other hand, unsupervised learning uses unlabeled datasets for training. These algorithms find hidden patterns in datasets that are unlabeled on their own without the need for external supervision. It is often used for clustering, the grouping of similar data. Another usage is for association that uses rules to find relationships among data, such as identifying online shoppers’ usual brought-together products. Unsupervised learning is also used in dimensionality reduction where extra data is removed while integrity is still preserved, such as removing noise from an image.
Machine Learning Models
Four major machine learning models are often used in industrial applications. These are Regression, Clustering, Neural Networks, and Decision Tree.
Linear Regression Algorithm
There are many machine learning algorithms for the Regression model, such as Simple Linear, Multiple Linear, Gaussian Nonlinear, Harmonic Nonlinear, and Polynomial Nonlinear Regressions. Here we will discuss Simple Linear Regression.
Linear Regression is a supervised learning algorithm that is used to estimate the value of a variable based on other continuous variables such as estimating energy consumption in a house. It is making a prediction by fitting the best line between the dependent and independent variables. This best-fit line is known as the regression line and is represented by a linear equation \(y = ax + b\).
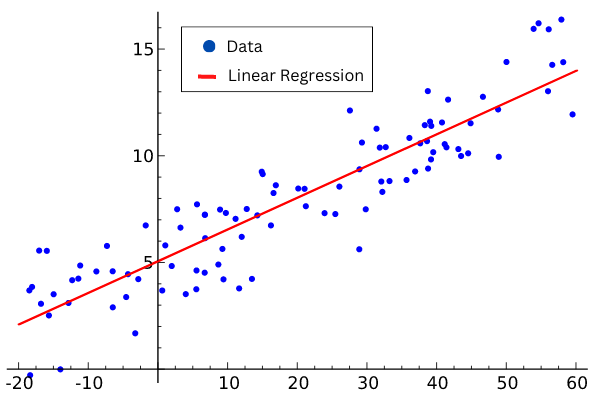
Figure 2. Linear Regression. Image adapted and used courtesy of Sewaqu
The algorithm uses visible parameters to guess a variable. For example, engineers can predict the energy cost by looking at the size of the compressor for a freezer. If the compressor is bigger, it usually uses more energy. It makes sense to correlate energy usage to the size of a compressor using the equation above.
The coefficients ‘a’ and ‘b’ are derived based on minimizing the sum of the squared difference of distance between data points and the regression line. Once determined \(a = 1.58\) and \(b = 8.36\), the linear equation \(y = 1.58x + 8.36\) will allow engineers to enter the size of the compressor (x) and estimate the energy usage (y).
Clustering Model: k-means ++ Algorithm
There are three major machine learning algorithms for the Clustering model, they are DBSCAN, k-means++, and Fuzzy k-means. Here we will take a look at the k-means++ Algorithm.
k-means++ is a variation of k-means that chooses the initial centers and gives a provable upper bound on the Within-Cluster-Sum-of-Squares (WCSS) objective, which we will discuss later. k-means clustering is an unsupervised algorithm and a method of vector quantization intended to partition observations into k clusters. Each observation belongs to the cluster with the nearest mean and represents a sample of the cluster. The algorithm partitions the data space into regions close to each of a given set of objects and minimizes the intra-class variances. k-means clustering is good at finding clusters of similar dimensional area.
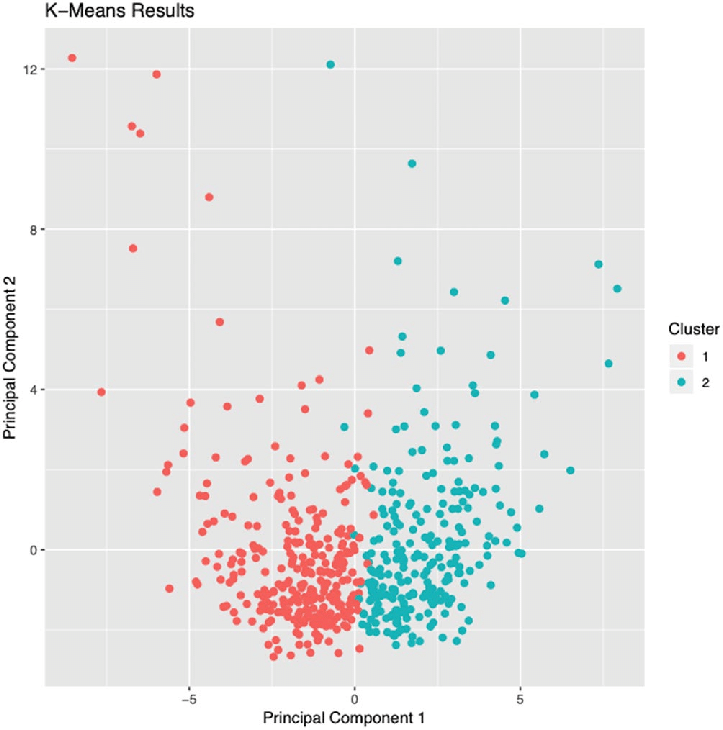
Figure 3. Scatter Plot of Observations. Image used courtesy of Hosoda et al.
An implicit objective function in k-means called Within-Cluster-Sum-of-Squares (WCSS) measures the sum of distances of observations from their cluster center. The function is represented as
$$WCSS = \sum_{i \in n}(X_i-Y_i)^2$$
where \(Y_i\) is the center for observation \(X_i\).
However, the k-means algorithm has some drawbacks. It is known that the worst-case running time of the algorithm is super-polynomial in the input size. In addition, the approximation found can be arbitrarily bad for the objective function compared to the optimal clustering.
The k-means++ algorithm addresses the shortcomings by specifying a procedure to initialize the cluster centers before proceeding with the standard k-means optimization iterations. With the initialization, k-means++ can always find a better solution than the best k-means solution.
Neural Network Algorithm
Neural networks are modeled after our human brains. The algorithm is designed to recognize different patterns and interpret data by using sensors, taking measurement, labeling, or simply using raw input. The patterns they recognize are numerical which are translated from real-world information, such as images and sound.
Neural networks consist of node layers which are an input layer, one or more hidden layers, and an output layer. Each node, or neuron, is linked to other nodes and has an associated weight and threshold. If the output of any single node is above the specific threshold value, that node is activated, and the data is sent to the next layer of the network. Otherwise, the data will not be sent to the next layer.
A good rule of thumb is to use 1 or 2 hidden layers if the data is not complex and has few dimensions. And if the data has large dimensions, 3 to 5 hidden can be used to attain an optimum solution. In general, the number of nodes in each hidden layer should be between the number of input and output nodes, as too few nodes will lead to more errors and too many nodes can overfit the training data.
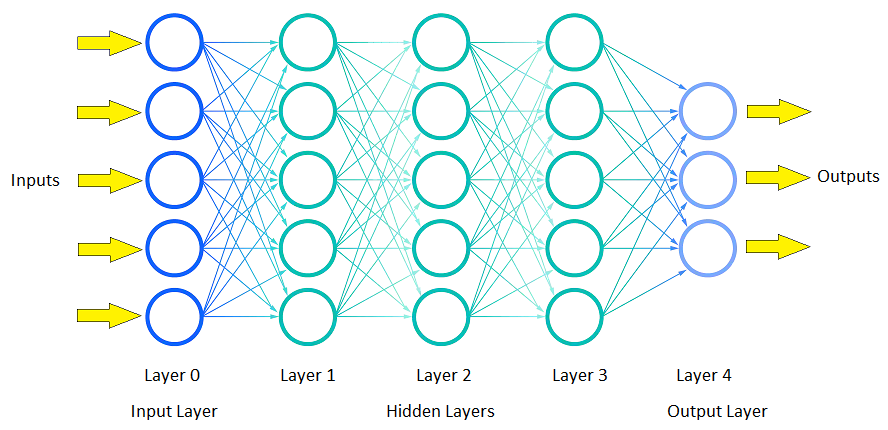
Figure 4. Feedforward Three-Layer Artificial Neural Network.
As an example, a neural network algorithm can be used to optimize the energy consumption for an industrial freezer. The goal is to minimize equipment usage, lower energy costs, and not compromise the quality of the products inside the freezer.
The following datasets can be used as variable inputs:
-
Temperature from multiple sensors
-
Temperature Setpoints
-
Utility rates during high peak and low peak
-
Current and forecast weather conditions
-
Inventory loads and how fast products are produced
-
Amount of human/forklift traffic
-
Number of times doors are open
The following can be outputted from the network:
-
Control inputs to the HVAC system
-
Real-time dashboard, reports, and alerts
-
HVAC maintenance recommendation
-
Optimal working conditions for the HVAC system
Decision Tree Algorithm
Decision Tree is a supervised learning algorithm that is mostly used for classification problems and works for both continuous and categorical variables. In this algorithm, we split the sample into two or more sub-samples based on the most significant differentiator in the input variables to the groups as diverse as possible. The algorithm generates easy-to-understand rules and performs classification without performing too much computation. It also provides a clear indication of what fields are important for prediction and classification.
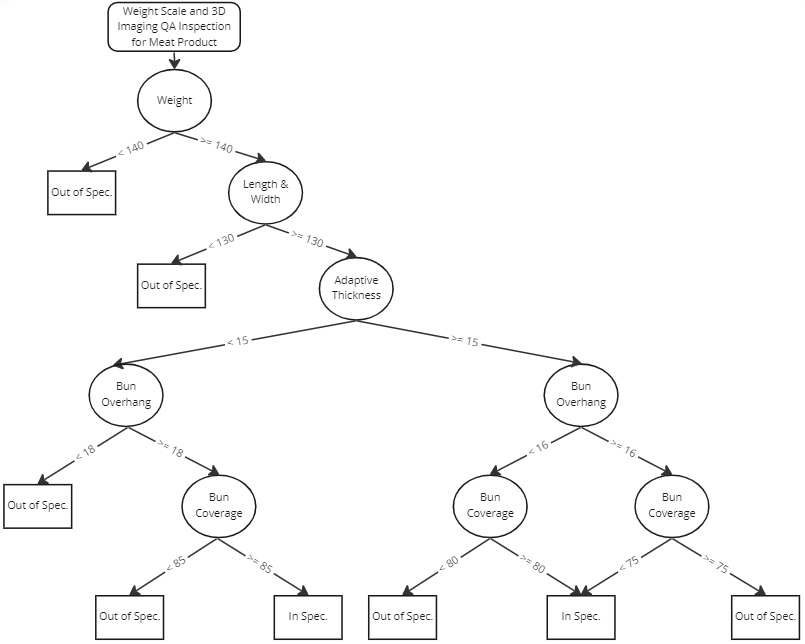
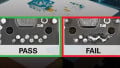
Figure 5. Decision Tree.
The above is an example of a decision tree used to decide if a product is within specification. It maps the possible outcomes of a series based on comparisons of different attributes to the specification limits. When a decision tree is used for prediction, engineers will weigh the possible actions or outcomes against one another based on their costs, probabilities, and benefits, and predict the best choice mathematically.
Like other supervised learning algorithms, the dataset of the tree is divided into training and test sets. The training set is a set of data paired with labels and used to train the algorithm. Once the algorithm is trained, the testing set is used to test the decision tree model and determine its performance.
A random forest is a classification algorithm and contains many decision trees. It is a meta-estimator that fits numerous decision tree classifiers on sub-samples of the dataset and uses averaging to improve the predictive accuracy and control over-fitting. Every tree in the forest functions independently and complements other trees, and the prediction from the forest is more accurate than any individual tree.