 Facebook
 Google
 GitHub
 Linkedin
The Journey of Data From Motor to Maintenance
Predictive maintenance brings real cost and time savings, but there can be a lot of confusion when setting up a system. Control.com talks to the experts at NORD, a motor specialist, to learn more.
Any time we see an exciting vendor demo or trade show exhibit, the first question is naturally, “How would this fit into my own system?” Such is the case with many predictive maintenance products.
Many of the concepts, like sensing, processing, and then scaling across an entire factory, are very real concerns that must be addressed right away.
Control.com was able to pose a few questions to the motor specialists at NORD Drivesystems. To begin the discussion, hardware insights were provided by Mark Arisman, the Manager of Business Development for Control Products.

We can treat this process as a journey; data starts at the final load equipment (the motor, in this case). It makes its way across communication channels, finally ending up in a database in a context that can be analyzed effectively. We’ll briefly discuss each step to investigate how this is accomplished in real-world systems.
At the Motor
David: I've seen condition monitoring sensors for vibration, temperature, as well as current and voltage to the motor. Is there any key benefit to each of those variables? Or is it always better to simply try to gather as many of these values as possible, where “more is always better?” If not all, which ones are the most critical?
Mark: When I think about this question, I think about the cost trade-off of including these sensor items. If cost were not involved, the answer would naturally be that more is better. Because we don’t typically know ahead of time what will be a critical parameter. We guess at this. Perhaps as we move forward in the IIOT world, this will become a clearer tradeoff.
Temp monitoring is inexpensive. Vibration is somewhat more expensive but perhaps could be if understood and selected properly. Current, voltage, and power all come along for the ride when you use a Nord VFD with the motor.
Lubrication monitoring is, honestly, perhaps the most important, yet it is often given very little consideration. We find that many drive unit failures are simply due to inadequate lubrication maintenance. This can be seen indirectly via temperature or vibration, but sometimes just monitoring the lubrication lifecycle and function would be better.
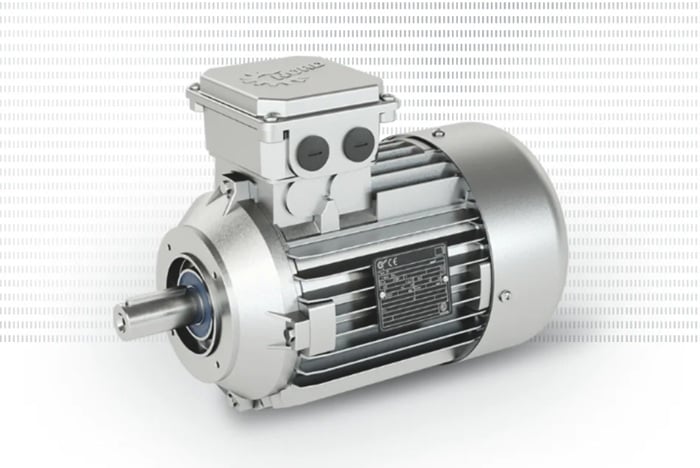
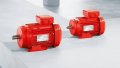
Figure 1. A typical 3-phase asynchronous motor. Image used courtesy of NORD
Motor to Controller
David: What are the various connection scenarios for these sensors? I can think of the following: sensors connected directly to an IPC (IIoT gateway), sensors to VFD which connects to the IPC gateway (MQTT?), and sensors to PLC, which relays the data points via network to the IPC gateway (also MQTT?).
Is this a complete list, and are there pros/cons of each option?
Mark: I think this is a complete list.
The main trade-off with the PLC is its memory and task bandwidth consumption. The PLC is a critical resource that should be handling logic control functions.
Offloading data gathering and analysis to another pathway, like an edge IPC or other IT function, often makes more sense. But there must be an architecture and a logical plan, or the data will be useless. OPC UA and MQTT are communication methods for this.
Sensors are becoming more intelligent and capable. In the coming years, they might be able to communicate directly with the analytic platform using these same methods.
The VFD provides some unique but critical data on the motor or drive system performance. Nord VFDs have a list of useful parameters that are monitored in real time. These can be collected and logged to track drive unit condition. When a high-function VFD is present in a drive system, the ability to read sensors locally and transmit all this data comes with it.
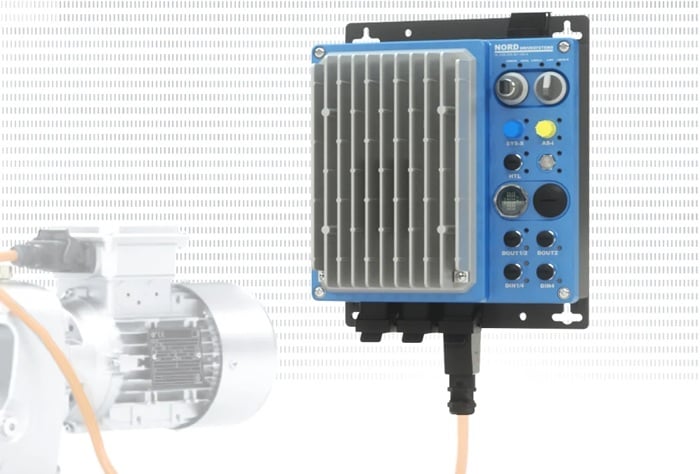
Figure 2. Motor drives often provide much of the essential data for assessing motor conditions. Image used courtesy of NORD
At the Controller
David: Without going into too much detail in the scope of this article, what is installed on this IPC? Is it purely just a gateway between the field devices and a remote database, or are there other data-processing apps? As in, can you do the condition monitoring right there on the device, or does it need to go to another location?
Mark: You certainly are performing much of the condition monitoring right on the IPC. It is collecting, cataloging, and presenting the real-time condition to a user. It is potentially the location for analysis as well. Alternatively (particularly if AI apps on the cloud are desired), an IT connection to the cloud is required to conduct advanced analysis beyond the IPC. That said, there are companies working on training AI agents for specific tasks like predictive maintenance. Perhaps these won’t all need cloud-based computing access at some point. This is a very exciting potential capability.
What is installed on our IPC in condition monitoring applications are Docker container elements that create data channels for the VFD to send time-stamped data that gets logged in a SQL database on the IPC. The graphical dashboard function comes from Grafana, which visually organizes the data and thresholds in the tile arrangement. Within this setup, we can also send Microsoft Teams messages to users when thresholds are violated. These messages can drive real maintenance action.
Controller to Analytics Software
David: What steps are required to package the data and send it to a remote location? When the data values are acquired from sensors or read from a controller, does it require custom programming to convert them into a format that can be transmitted to the predictive maintenance software?
Mark: It does not necessarily require custom programming. There are so many available ways to manage, package, and communicate SQL-based data. For software that requires a custom database arrangement, there would have to be conversion elements either before or after data transmission.
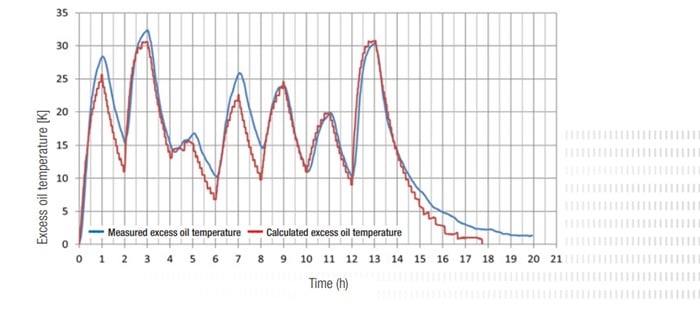
Figure 3. Comparing projected and measured values can help assess equipment performance. Image used courtesy of NORD
Inside the Analytics Software
David: Who/what actually performs the analysis? Do you need to pay for a separate analytics software to take the raw data, trend it, examine for anomalies, and then provide alerts? Also, what kind of special skills does the company need in-house to handle this kind of work?
Mark: Simple solutions are available off the shelf to trend, set thresholds, and even send alerts. True analysis requires separate analytics software, which would have its own cost and require its own ROI analysis.
IT skills would need to be pulled in to evaluate and manage these types of solutions, particularly if they require operation on the cloud or advanced analysis of sensitive company information.