Facebook
 Google
 GitHub
 Linkedin
Good afternoon Phil Corso and ControlsGuy25 .
I´m not comparing apples and oranges.
First things first.
As I´ve reported, I´m interested on the SIR - synchronous inertial response - of our generators.
I´m fully aware of the governors different technologies and speed responses.
But, for now, I just want to address the SIR and the resulting RoCoF.
Our grid is small, isolated from the mainland. There are no ties that can help us on outages and prevent frequency excursions.
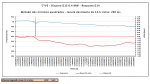
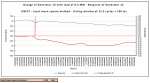
Since we have only around 30 synchronous generators ( fuel, natural gas, steam and hydro ) I can easily calculate the expected RoCoF after an outage of the instantaneous highest power output generator (N-1).
The issue is that, performing "post-morten" outage events analysis, the measured RoCoF is always lower than the expected calculated one.
We are a small tourist island with no synchronous motors on the grid.
I´m aware that induction motors on the grid will provide some inertia, lower and slower than synchronous machines.
We also have several wind generators farms that, specially the oldest ones, will also provide some inertia.
It´s a quest for the lost inertia.
But I know we could consider a frequency-dependent load damping effect. I´m focusing on that issue. Normally it gets neglected but I want to demonstrate that it exists and maybe justifies the calculated and measured RoCoF differences.
My goal is to demonstrate to my Dispatch Center colleagues that the inertia they consider, is not provided by the old, high inertia constant, fuel generators.
One of our old diesel generators has almost the same kinetic energy than one of the brand new natural gas driven generators.
The lost inertia is elsewhere. I´m looking for it.
The governors response will be addressed in due time.
All your comments will be greatly appreciated.
Best regards.
Carlos Melim
I´m not comparing apples and oranges.
First things first.
As I´ve reported, I´m interested on the SIR - synchronous inertial response - of our generators.
I´m fully aware of the governors different technologies and speed responses.
But, for now, I just want to address the SIR and the resulting RoCoF.
Our grid is small, isolated from the mainland. There are no ties that can help us on outages and prevent frequency excursions.
Since we have only around 30 synchronous generators ( fuel, natural gas, steam and hydro ) I can easily calculate the expected RoCoF after an outage of the instantaneous highest power output generator (N-1).
The issue is that, performing "post-morten" outage events analysis, the measured RoCoF is always lower than the expected calculated one.
We are a small tourist island with no synchronous motors on the grid.
I´m aware that induction motors on the grid will provide some inertia, lower and slower than synchronous machines.
We also have several wind generators farms that, specially the oldest ones, will also provide some inertia.
It´s a quest for the lost inertia.
But I know we could consider a frequency-dependent load damping effect. I´m focusing on that issue. Normally it gets neglected but I want to demonstrate that it exists and maybe justifies the calculated and measured RoCoF differences.
My goal is to demonstrate to my Dispatch Center colleagues that the inertia they consider, is not provided by the old, high inertia constant, fuel generators.
One of our old diesel generators has almost the same kinetic energy than one of the brand new natural gas driven generators.
The lost inertia is elsewhere. I´m looking for it.
The governors response will be addressed in due time.
All your comments will be greatly appreciated.
Best regards.
Carlos Melim