Facebook
 Google
 GitHub
 Linkedin
Create Your Own IIoT Tech Stack Project | Part 8: Final - Data Dashboard
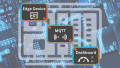
In this final installment of the IIoT tech stack project, learn how to design the customer-facing dashboard or observability platform using the data acquired from the MQTT client device.
Explore the previous articles in the series of designing your own IIoT project, from initial sensor data collection on a Linux platform through this final conclusion of converting the data payload into actionable data visualizations.
Part 2: Testing The Data Payload
Part 3: Commissioning MQTT Broker
Part 4: Connecting MQTT Client to Broker
Part 7: Integrating Data With Database
Now that data has been acquired, packaged, sent to an MQTT broker, and then stored in a database, it’s finally time to USE the data to observe trends and make logical decisions for future system improvement (even if that’s just the comfort of your own home, in this project).
Grafana Data Visualization Paltform
The observability platform we will use to visualize the sensor data in InfluxDB is Grafana. Grafana is an open-source dashboarding tool built by Grafana Labs that is commonly used for IoT time series applications. It provides integration support to a suite of data sources including databases, cloud assets, and time-series databases like InfluxDB. The platform makes developing dashboards relatively quick with an intuitive user interface. Other features include alerts, dashboard templates, and third-party extension/plug-in support.

Figure 1. Grafana Labs marketing material. Image used courtesy of Grafana
Building the Grafana Container
You guessed it! We’ll use a docker container attached to the private virtual network where we’ve attached our previous containerized applications. If you have other containers running, use the docker compose down command to spin down active containers. Shutting down is required to update the docker-compose.yaml file with a service for Grafana. The service can be added below the nodered service.
 grafana:
    image: grafana/grafana:latest
    container_name: grafana
    ports:
      - "3000:3000"
    volumes:
      - ./grafana_data:/var/lib/grafana:rw
    environment:
      - GF_SECURITY_ADMIN_USER=admin
      - GF_SECURITY_ADMIN_PASSWORD=adminpassword
    networks:
      - local_iot_network
Saving the compose file and running docker compose up -d yields the following terminal output:
mlevanduski@Michaels-MacBook-Pro IoTProject % docker compose up -d
[+] Running 11/11
 ✔ grafana 10 layers [⣿⣿⣿⣿⣿⣿⣿⣿⣿⣿]      0B/0B      Pulled                                                                                                                  20.8s
   ✔ 9fda8d8052c6 Already exists                                                                                                                                           0.0s
   ✔ 63d78c4b9e46 Pull complete                                                                                                                                            0.9s
   ✔ 17b6444f0ceb Pull complete                                                                                                                                            1.7s
   ✔ 34951378823f Pull complete                                                                                                                                            1.0s
   ✔ 352c214fd260 Pull complete                                                                                                                                            1.9s
   ✔ 40dbea5581ca Pull complete                                                                                                                                            3.0s
   ✔ bf06f42604a1 Pull complete                                                                                                                                           11.8s
   ✔ c9061899430d Pull complete                                                                                                                                           14.0s
   ✔ 7f461d005961 Pull complete                                                                                                                                            4.6s
   ✔ f114f37263d3 Pull complete                                                                                                                                            6.2s
[+] Running 5/5
 ✔ Network iotproject_local_iot_network  Created                                                                                                                           0.0s
 ✔ Container nodered                     Started                                                                                                                           0.2s
 ✔ Container grafana                     Started                                                                                                                           0.2s
 ✔ Container mosquitto                   Started                                                                                                                           0.2s
 ✔ Container influxdb                    Started
The Grafana container can be accessed at http://localhost:3000. Upon navigating to the URL, enter the username and password defined in the compose yaml file Grafana service:

Figure 2. Grafana Labs opening logic page. Image used courtesy of the author
Integrating to InfluxDB
Now that we are logged in to the Grafana UI running in the container, we can begin to integrate this final step. Let’s select the ‘Data Sources’ widget and be guided through the integration steps.

Figure 3. Option for choosing a first data source. Image used courtesy of the author
InfluxDB will be supported natively indicated by the core tag within the ‘time series databases’ section. Select the widget:

Figure 4. Selecting InfluxDB as the data source. Image used courtesy of the author
A configuration window should appear. Since the window is fairly long, I’ll provide details for each respective section. In the Query Language select 'Flux.'

Figure 5. Configuring the query language. Image used courtesy of the author
Within the HTTP section, provide the local IP address of the local machine with the port InfluxDB is bound to.

Figure 6. Configuring the URL field with IP address and port number. Image used courtesy of the author
In the Auth section enter the username and password for the InfluxDB container which we defined in the environment variable .env file (review Part 5 for .env details). Basic auth should be selected by default.

Figure 7. Configuring the user name and password from the .env variables. Image used courtesy of the author
Within the InfluxDB ‘Details’ section, we will provide the organization, bucket, and token defined in the environment variable .env file for the InfluxDB service (again, review Part 5 to ensure you can find the variable details).

Figure 8. Configuring the InfluxDB variable details. Image used courtesy of the author
At the very bottom of the window select 'Save & test.' If the connection succeeds, a green box should appear.

Figure 9. Successful test of the connection to the InfluxDB ‘sensor’ bucket. Image used courtesy of the author
Success! Within the green box, we can select ‘building a dashboard’ to begin the front-end UI work.
Building a Dashboard
Having never used this particular Grafana service prior to this article, I was pleasantly surprised by how seamless and easy it was to get a dashboard up and running. To begin a dashboard we’ll select the ‘Add visualization’ button.

Figure 10. Adding an initial visualization for the data. Image used courtesy of the author
Select the InfluxDB data source we defined in the prior section.

Figure 11. Selecting the InfluxDB source. Image used courtesy of the author
A large UI window will appear. There are an overwhelming amount of options, but let’s focus on the lower right hand pane of the window.

Figure 12. Specific details for Flux query script input section. Image used courtesy of the author
We can provide a Flux query within Grafana that will execute against the InfluxDB bucket. The Flux language is somewhat peculiar, and the learning curve is not something a casual user (like myself) would pick up quickly. But don't worry, this won't be a big problem!
Within our InfluxDB container running on port 8086, we can have a query built for us in the Data Explorer window for the sensor bucket. In fact, we’ve already navigated to this window back in the prior article (pay attention to Figure 10 in the Part 7 article). Select 'Script Editor.'

Figure 13. Script editor in InfluxDB. Image used courtesy of the author
When we toggle into ‘Script Editor,’ the graphical selections we made back in Part 7...

Figure 14. Selecting the data sets before toggling to ‘Script Editor’ mode. Image used courtesy of the author
…Will be replaced with our desired Flux query here.

Figure 15. Code to be used for data query from InfluxDB. Image used courtesy of the author (click the image to enlarge)
Copy and paste this query code into the Grafana interface.

Figure 16. InfluxDB query in the Grafana workspace. Image used courtesy of the author
Click ‘Apply’ in the upper right hand corner. Upon doing so, we’ve created our first dashboard!

Figure 17. Data is displayed in a line chart time-series format. Image used courtesy of the author
Obviously, this is a skeleton example in one graph, so the formatting could greatly be improved. Hopefully, this provides a starting point for you to branch off and customize your own dashboard, with initial improvements like separating the graphs for individual y-axis scales and limits to display safe tolerance ranges.
Your Very Own IIoT Project!
If you’ve made it to the end of this technical series, congratulations! I hope you’ve learned more about the full stack of software applications used within IIoT.
These tools require a wide breadth of knowledge, and there is a lot of technical work that needs to go into the backend of any customer-facing dashboard. Hopefully this series serves as a rough introduction to a simple IIoT solution.
If you’ve used this series to build a project of your own, we’d like to hear about it in the comment section below!
Related Content