Facebook
 Google
 GitHub
 Linkedin
Create Your Own IIoT Tech Stack Project | Part 7: Integrating Data With Database
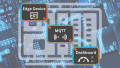
As we approach the conclusion of this IIoT project, we’ll explore the integration of the Mosquitto MQTT broker, Node-RED, and InfluxDB, leaving only the data dashboard setup for the final step.
Explore the previous articles in the series of designing your own IIoT project, from initial sensor data collection on a Linux platform through the current discussion of transferring the data payload from the Node-RED software to the InfluxDB.
Part 2: Testing The Data Payload
Part 3: Commissioning MQTT Broker
Part 4: Connecting MQTT Client to Broker
Integrating systems is no small task. Enterprise companies have entire teams dedicated to building and maintaining integrations. As such, the field can be very detailed and deep. However, as control engineers, we need to understand at least the basics in order to integrate the various systems encountered in the industrial environment.
Funneling Data to InfluxDB
InfluxDB offers several methods of writing data into the application. There is no shortage of options which include:
- Telegraf (by InfluxData)
- Scrape data
- CSV upload
- Influx CLI (command line interface)
- InfluxDB API (application programming interface)
We will use the InfluxDB API to integrate the Raspberry Pi’s sensor data payload. Before we begin, there is a data contract of sorts from InfluxDB that we must review.
InfluxDB Line Protocol
If you recall, one of the marketed benefits of NoSQL (non-structured) style databases was the flexibility of being able to insert data without a schema. So, that means we should be able to throw JSON payloads of unstructured data into InfluxDB, right? Well, not entirely.
In order to optimize the database engine, InfluxDB still requires written data to take the form of Line Protocol. It’s not the same as a relational database schema, but it definitely is not as flexible as simply sending masses of numeric values without definition. While we, as customers, lose some flexibility, we do obtain a database with some of the highest writing throughput in industry. Similar to physical engineering systems, there are tradeoffs and balances of the capabilities. The protocol consists of a measurement, tag values, field values, and a timestamp.

Figure 1. Sample elements of line protocol. Image used courtesy of Influxdata
The measurement key and the tag key value pairs (as in tag1 and tag2 above) must be of string data type and offer a more qualitative or descriptive context to the payload.
The field keys (field1 and field2 above) must be strings, but the values (shown as v1 and 1i above) can be a variety of data types. The field keys represent the actual quantitative measurements, such as the temperature and pressure readings in our payload sent from the Sense HAT on the Pi.
The timestamp can be supplied from the client side, but if it is not specifically provided, InfluxDB will append a timestamp once the data arrives at the server (server side). For curious minds, more details on Line Protocol can be found here.
Transforming Payload Into Line Protocol
With the structure of Line Protocol known, we need to transform the JSON structure of the Raspberry Pi payload. The structure at the start of the flow appears below:
{
"hostname": "raspberrypi",
"temperature": "31.517805099487305",
"pressure": "922.594482421875",
"humidity": "30.99437713623047"
}
The payload can be converted by using a function node. The function node allows engineers to build custom Javascript functions to perform operations within flows. The function we will utilize simply extracts the data from the Raspberry Pi payload and formats it to the rules of Line Protocol. Insert the function node into the flow workspace.

Figure 2. Function node from the Node-RED workspace. Image used courtesy of the author
Double-click on the function node, enter the “On message” tab, and enter the JavaScript code below:
const hostname = msg.payload.hostname;
const temperature = msg.payload.temperature;
const pressure = msg.payload.pressure;
const humidity = msg.payload.humidity;
const measurement = "senseHAT";

const tags = `hostname=${hostname}`;
const fields = `temperature=${temperature},pressure=${pressure},humidity=${humidity}`;

const lineProtocol = `${measurement},${tags} ${fields}`;
msg.payload = lineProtocol;
return msg;
You may name the function node anything you wish; I’ve chosen “Line Protocol Builder”. Click done when finished.

Figure 3. Edited function node from the Node-RED workspace. Image used courtesy of the author
Validation Test
Before defining the API endpoint, let’s visualize what happens when we pass a payload to the function node.
For this exercise, please feel free to use the previously-created physical Pi mqtt in node to supply the inject payload. However, when writing this article, I did not have access to my own Pi due to travel. Thus, an alternative, and possibly better, method of injecting a payload for development purposes is the native inject node. The node allows you to set a payload and recursion frequency to inject to the workspace.

Figure 4. Inject node from the Node-RED workspace. Image used courtesy of the author
Right below this node is a “debug” node which we will use to visualize the function output.

Figure 5. Debug node from the Node-RED workspace. Image used courtesy of the author
Once assembled and deployed, clicking the blue box next to the inject node should start the flow. The results will appear in the debug pane to the right of the screen.

Figure 6. Testing the workflow from payload to Line Protocol output in the Node-RED workspace. Image used courtesy of the author
This looks promising! Now, instead of a debug output, let’s implement it with the real system and send the data using the InfluxDB API endpoint.
Calling the API Endpoint
Now that our payload has been transformed into the proper line protocol, we can define the request command that we will send to the InfluxDB API. To start, let's add the native http request node to our flow workspace.

Figure 7. HTTP request node from the Node-RED workspace. Image used courtesy of the author
Double-click on the http request, and a configuration UI will appear. For reference, we will use the API endpoint defined by the Influxdb2 documentation here. The required endpoint URL, headers, and payload are all defined within the documentation. Populate the following fields below to adhere to the documentation:

Figure 8. Edited HTTP request node from the Node-RED workspace. Image used courtesy of the author
Note the URL and Token fields are defined as below (if needed, refer back to the .env setup in Part 5 of this series):
- URL - http://ipaddress_of_your_machine:8086/api/v2/write?bucket=sensor&org=home
- The red fields are parameterized depending on the variable names you assigned the bucket and org values in the .env file passed to the InfluxDB container
- Token - The token variable defined in the .env file passed to the InfluxDB container
Click Done and the flow should appear as below:

Figure 9. Final Node-RED workflow from data input to database output. Image used courtesy of the author
Verifying API Receiving Data
Log in to the InfluxDB container running on your local machine port 8086. Clicking on the sensor bucket and drilling down, you should see a UI similar to below. Hitting the ‘submit’ button yields a graph of the data being sent from the Raspberry Pi.

Figure 10. Verification that the InfluxDB database is receiving the payload from Node-RED. Image used courtesy of the author
Next Steps: Visualizing the Data
We’ve accomplished the hardest part of integration! In the final (forthcoming) article in the series, we can explore some options that exist for the visualization and dashboarding of the data.
Related Content