 Facebook
 Google
 GitHub
 Linkedin
Introduction to Optical Analysis
Light is known to interact with matter in very specific ways, which may be exploited as a means of measuring chemical composition. Either a sample of the substance to be analyzed is stimulated into emitting light (optical emission), or made to absorb light from an external source (optical absorption). The specific frequencies (colors) of light obtained from these analyses serve to identify the chemical elements and/or compounds present in the sample, and the relative intensities of each spectral pattern indicate the concentrations of those elements and/or compounds.
The theoretical basis for optical analysis is the interaction between charged particles of matter and light, which may be modeled both as a particle (called a photon) and as an electromagnetic wave possessing a frequency (\(f\)) and a wavelength (\(\lambda\)). Thanks to the work of the physicists Max Planck and Albert Einstein at the beginning of the 20th century, we know there is a definite proportionality between the frequency of a light wave and the amount of energy carried by each photon (\(E\)). This proportionality is Planck’s constant, or \(h\):
\[E = hf\]
Where,
\(E\) = Energy carried by a single “photon” of light (joules)
\(h\) = Planck’s constant (6.626 \(\times\) \(10^{-34}\) joule-seconds)
\(f\) = Frequency of lightwave (Hz, or 1/seconds)
If the amount of energy carried by a photon happens to match the energy required to make an atomic electron “jump” from one energy level to another, the photon will be consumed in the work of that task when it strikes the atom. Conversely, when that same electron returns to its original (lower) energy level in the atom, it releases a photon of the same frequency as the original photon that dislodged the electron. Thus, energy is conserved (as always!): the energy received by the atom from the incident photon is later released in the form of another photon carrying the same amount of energy.
Since each element’s electron configuration is unique, each element’s electrons respond differently to light. Both the colors (frequencies) of light required to boost electron energy levels and the colors (frequencies) of light emitted by those atoms as their electrons fall back to their original energy levels constitute a unique “optical fingerprint” for identifying elements.
Molecular motion (i.e. temperature) is also a source of photon emission. Warm objects radiate energy in the form of electromagnetic radiation, which is why we are able to remotely measure the temperature of an object by the optical radiation it emits.
If we examine the visible light spectrum (a range of wavelengths spanning 700 nm to 400 nm, corresponding to a range of frequencies spanning \(4.29 \times 10^{14}\) Hz to \(7.5 \times 10^{14}\) Hz) emitted by a blackbody heated to a temperature of 5700 Kelvin, we see a continuous spectrum of color from violet on the left (short wavelength, high frequency, high energy) to red on the right (long wavelength, low frequency, low energy). Here, I am using a computer program called Spectrum Explorer (SPEX) to map both the color spectrum and the intensity of radiation across a range of wavelengths:
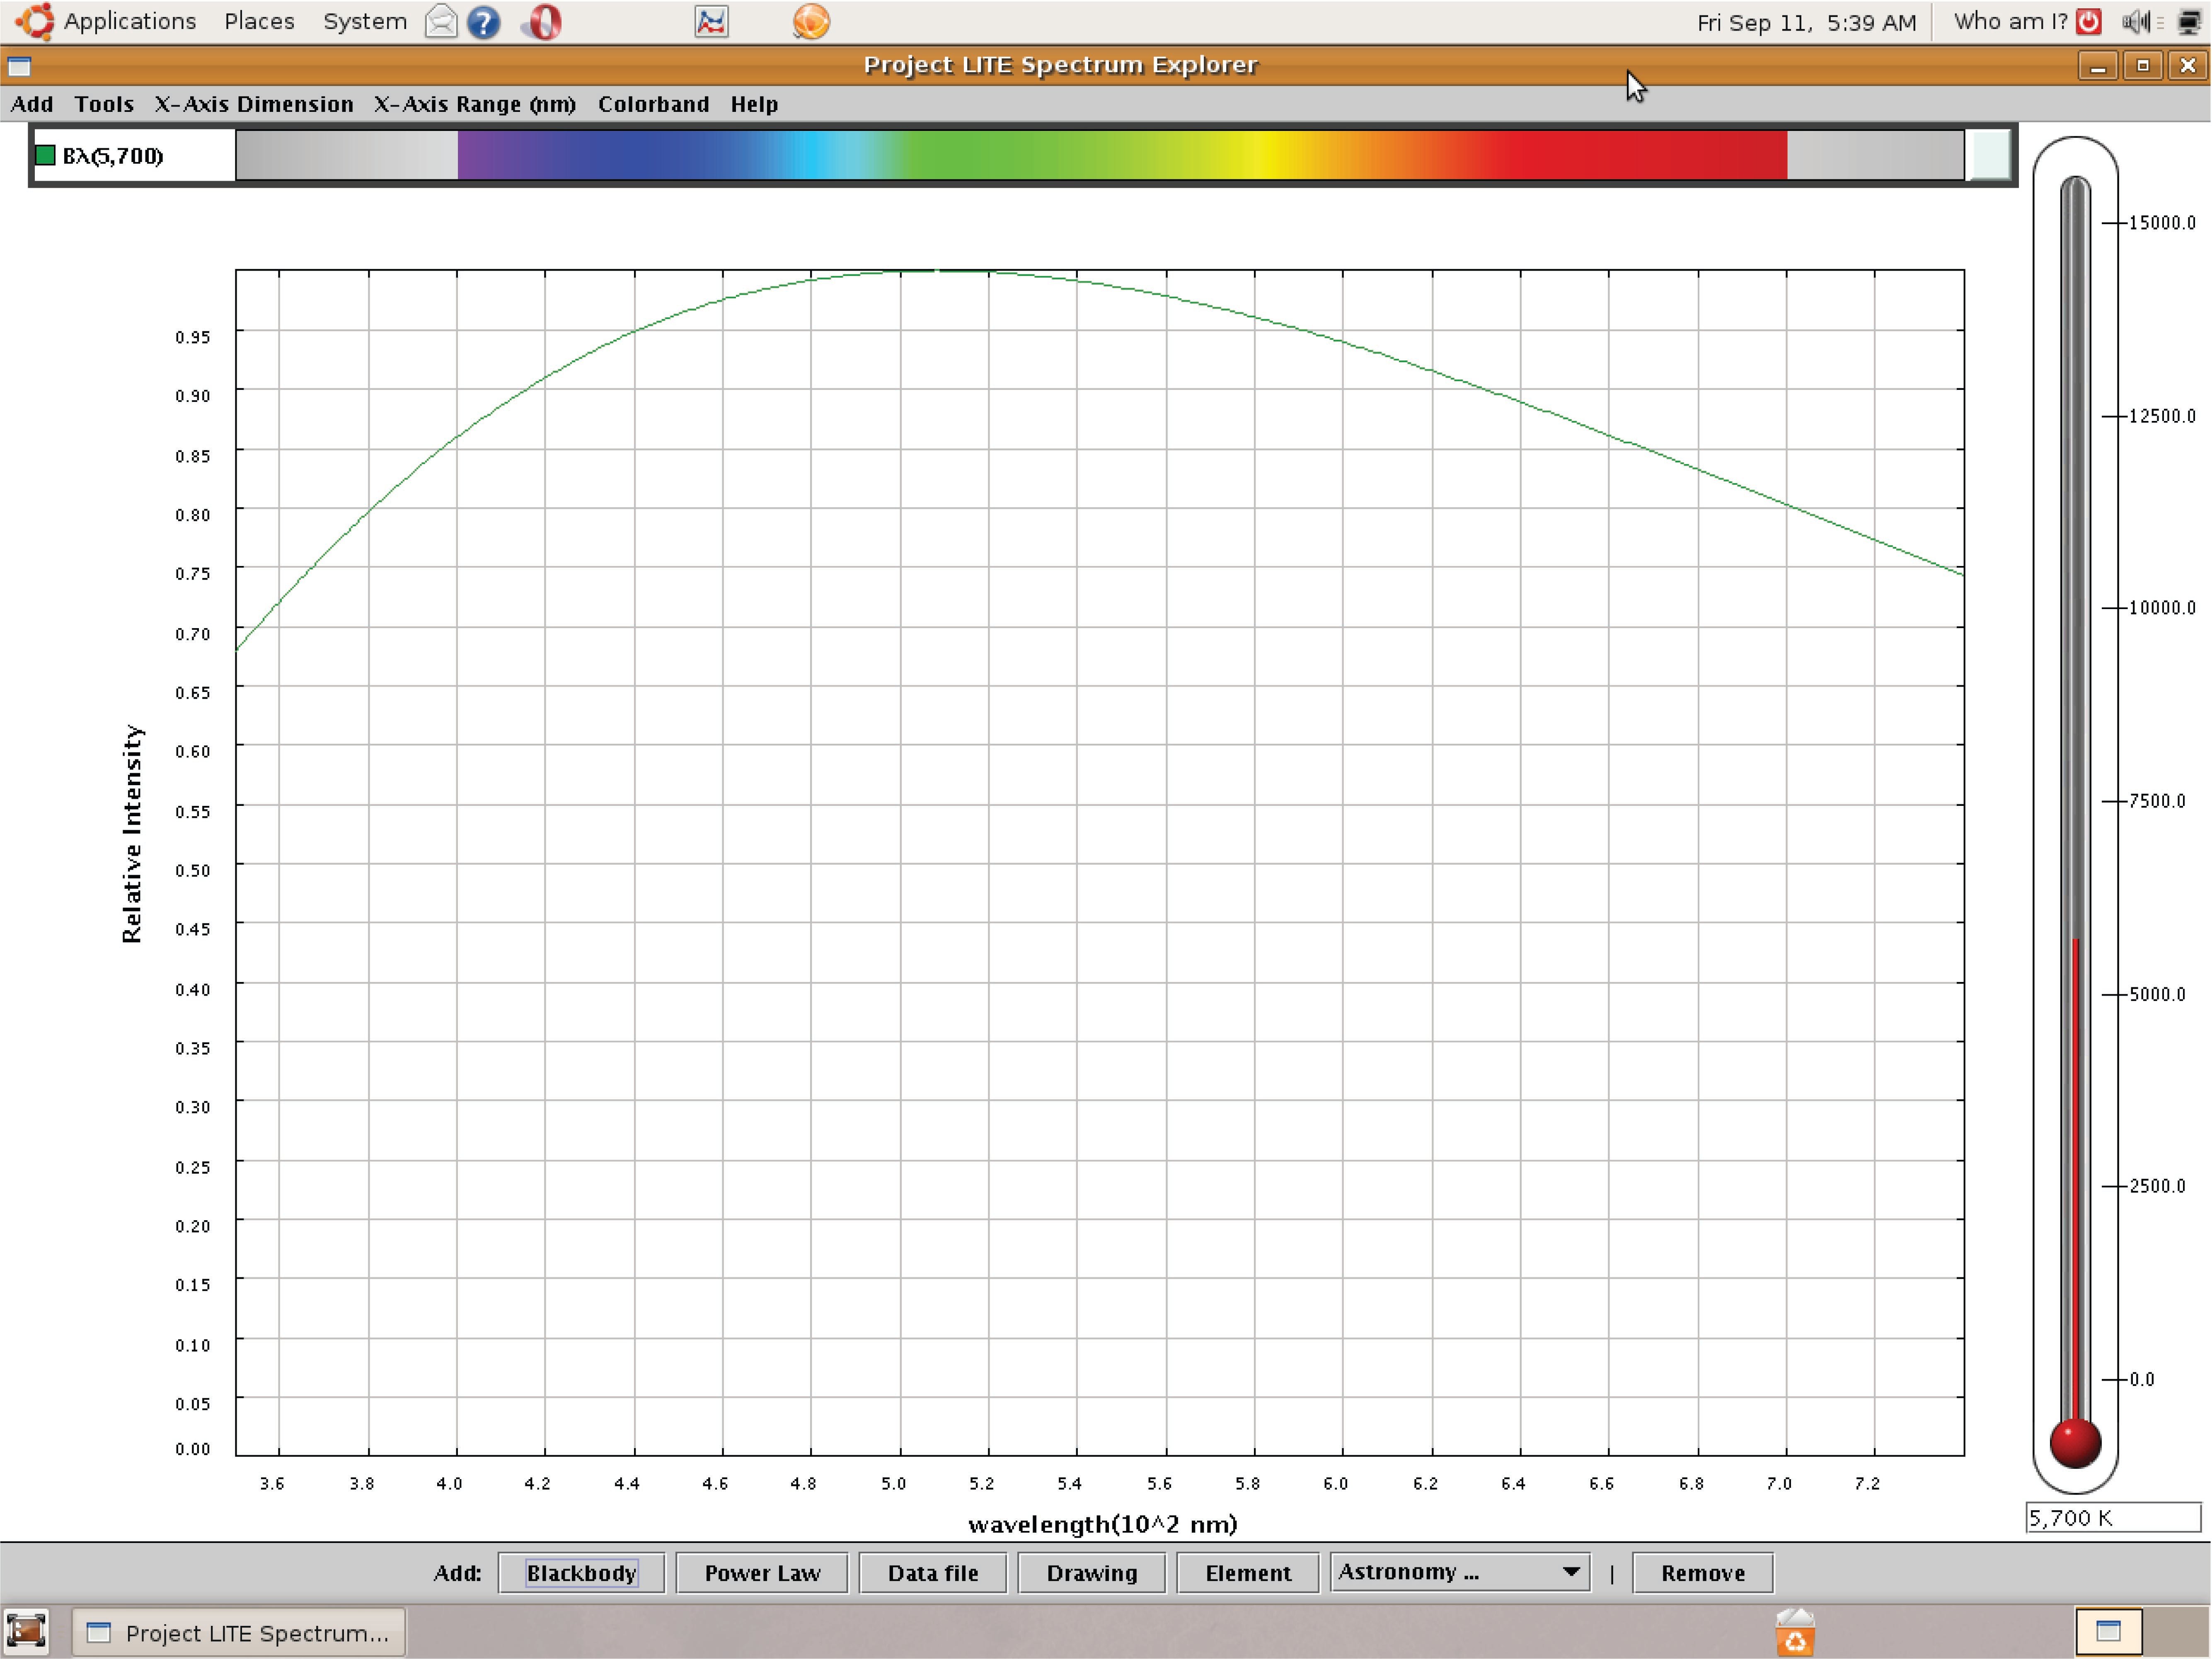
Unless the light from a heated blackbody passes through some device to separate it into its constituent colors, the human eye blends all the colors together and only sees white. Thus, we use the term “white light” to refer to an equal mixture of light frequencies covering the visible spectrum. The grey areas to the far left and far right of the spectrum represent the ultraviolet and infrared regions, respectively, that lie outside of the human vision range. A blackbody heated to 5700 K emits substantial quantities of both ultraviolet and infrared radiation, but this radiation is invisible to the human eye.
If we take a sample of pure hydrogen gas and heat it using an electric arc (inside a glass tube), the hydrogen atoms’ electrons will be forced into higher energy states by the passage of electric current through the gas. As those electrons fall back to lower original energy levels, they emit photons of characteristic wavelengths (color). These wavelengths do not cover the visible spectrum as they do for blackbody objects, but rather reveal themselves as thin “lines” on the visible spectrum range, and as “peaks” on the intensity plot:
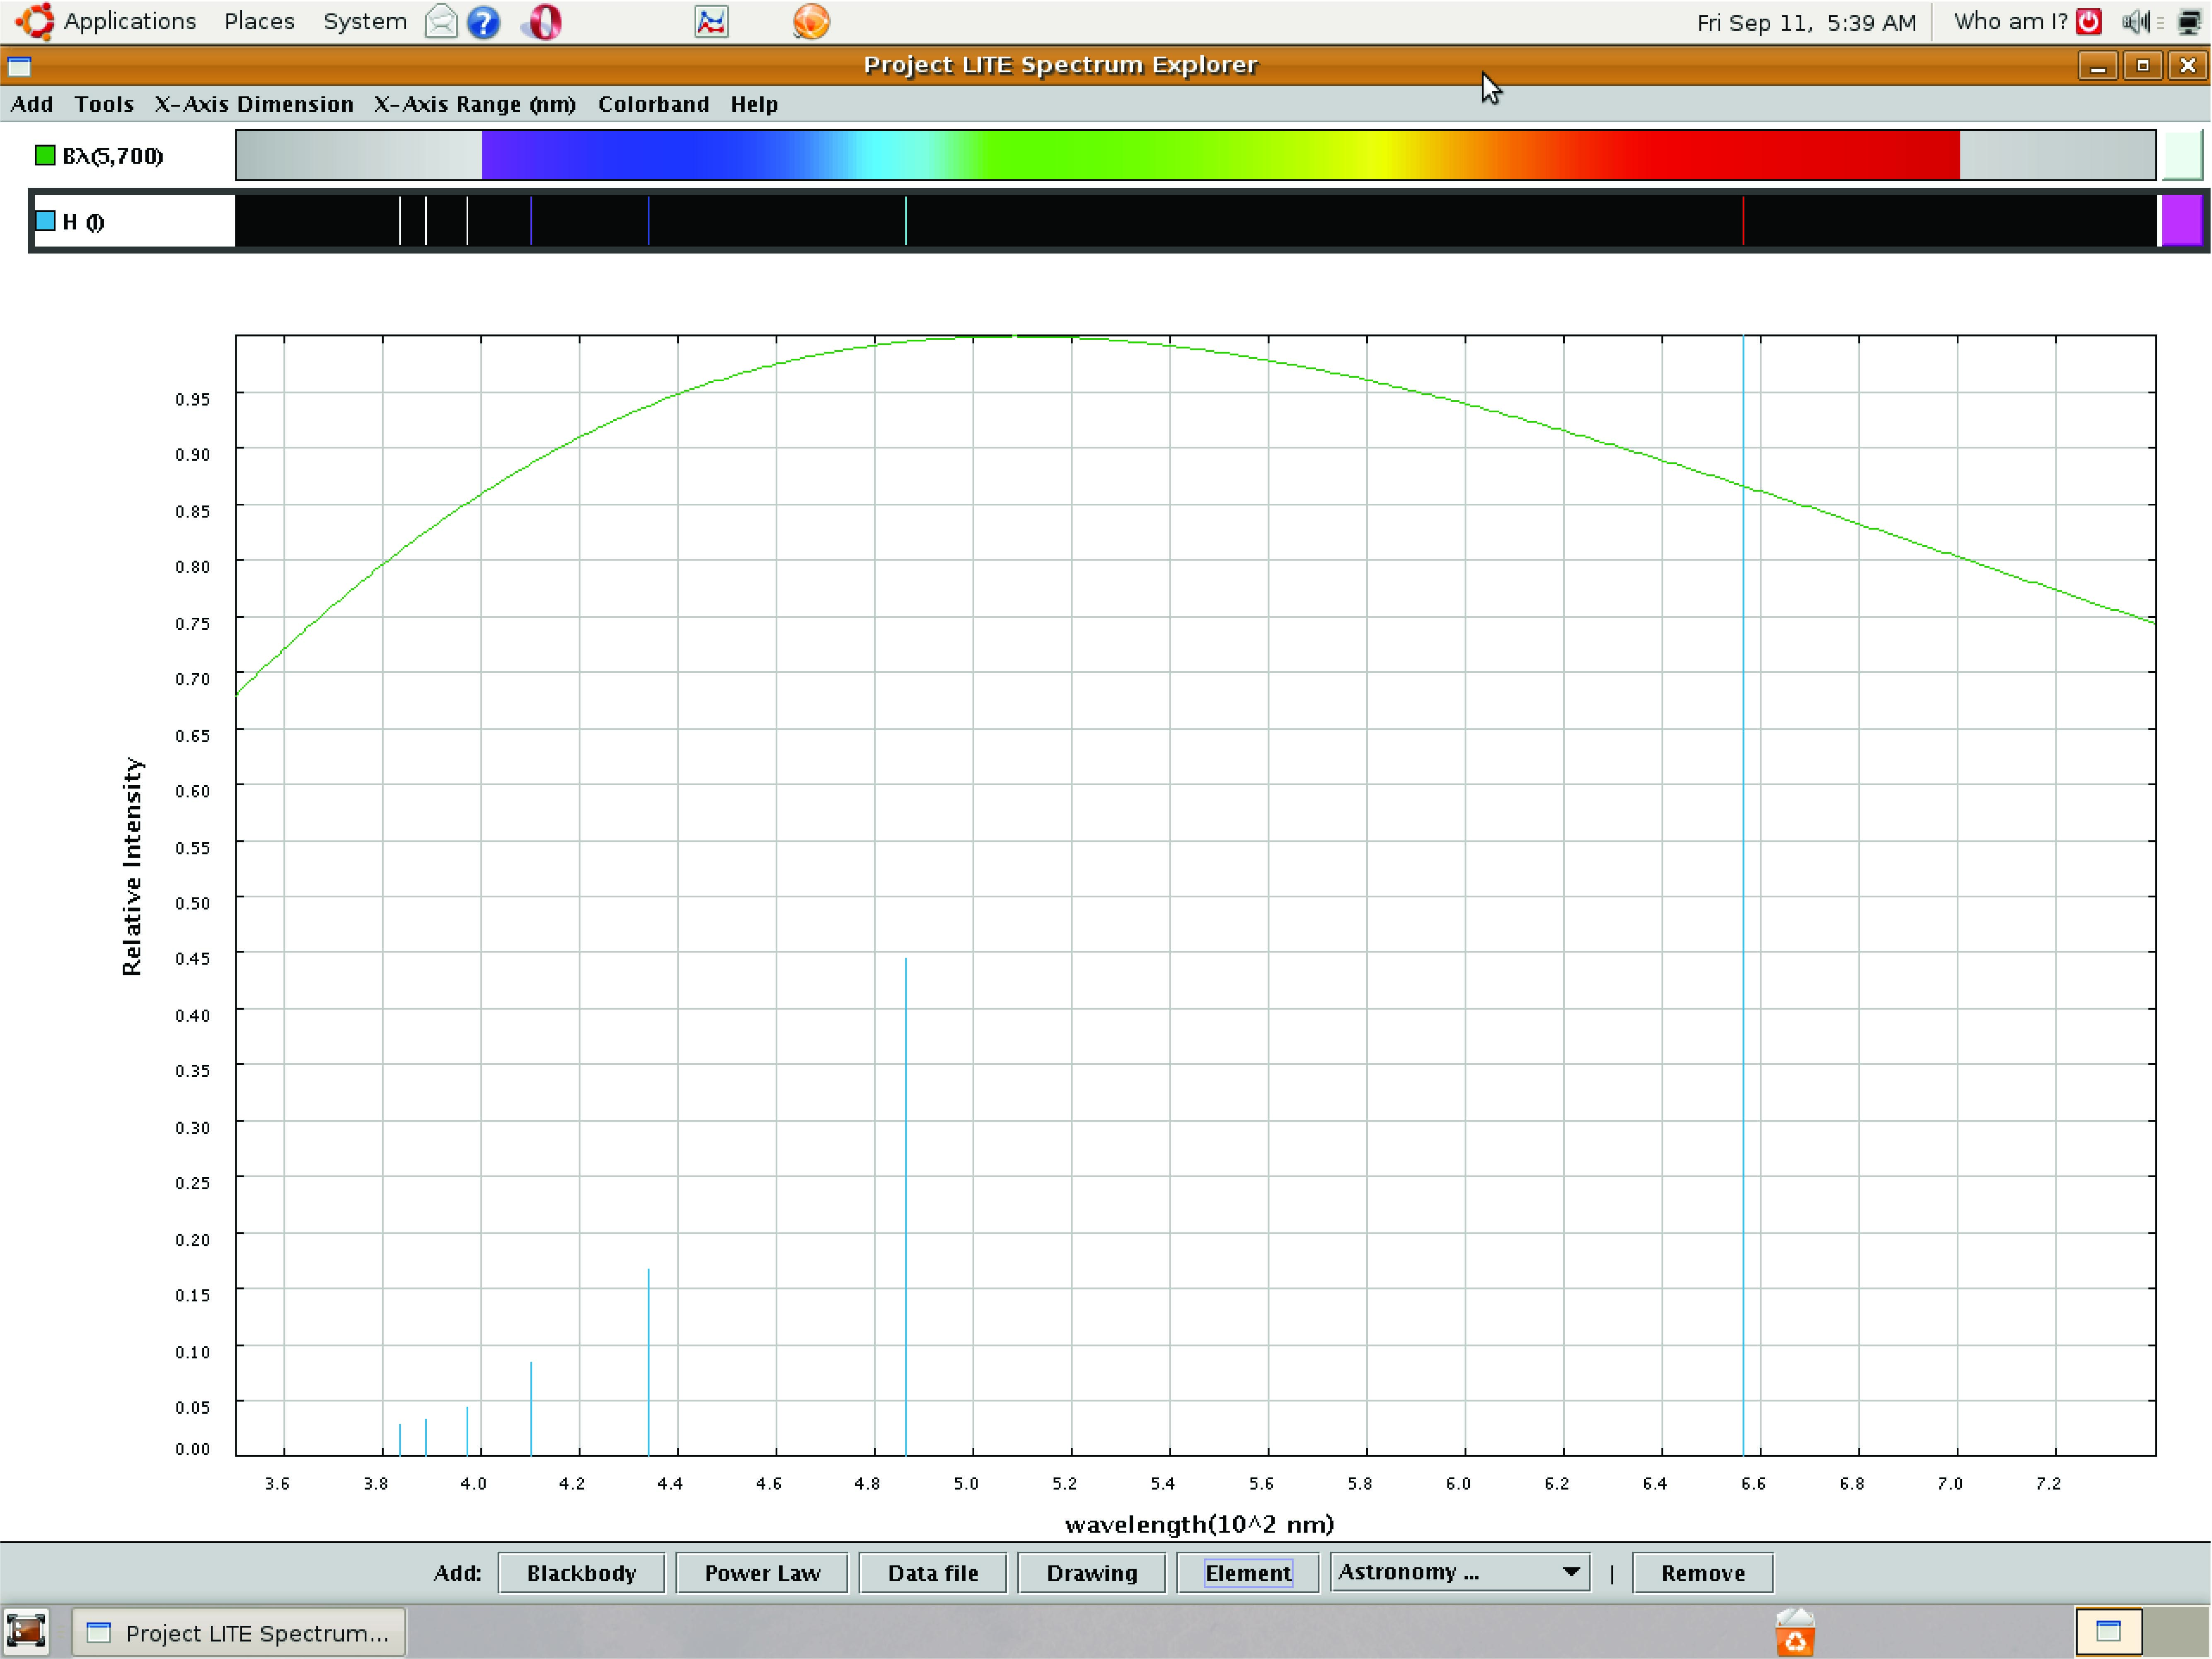
Viewed with the unaided human eye, the light emitted from a hydrogen gas discharge tube looks bright red, because that is the predominant wavelength emitted. The other colors tend to be overshadowed by the red, but we can still view them if we pass the light through a prism or through a diffraction grating to split it up into its constituent colors.
This particular set of “lines” is unique for the element hydrogen, and may serve as an identifying “fingerprint” for hydrogen if found in the emission spectrum for any chemical sample generated by the same method.
An alternative to electrically stimulating a quantity of hydrogen gas and thereby forcing an emission of specific wavelengths is to pass white light through a sample of hydrogen gas and then look for which colors are absorbed by the gas. As mentioned previously, photons having the necessary energies (frequencies) will become consumed in the work of elevating the hydrogen atoms’ electrons to higher energy levels, leaving dark lines in an otherwise unbroken spectrum of colors from violet to red. This is called the absorption spectrum for an element, in contrast to the emission spectrum obtained by electrically energizing atoms of that element to emit light.
The following illustration shows three different spectra: the full-color (white light) spectrum of white light (top), the emission spectrum of hydrogen gas (middle), and the absorption spectrum of hydrogen gas (bottom). Note how the dark gaps in the absorption spectrum precisely match the positions and colors of the bright lines in the emission spectrum, because the wavelengths of light absorbed from white light as it passes through hydrogen gas are the exact same wavelengths emitted by hydrogen gas when stimulated by an electric spark in a glass tube:

The dark lines found in the absorption spectrum constitute a distinctive “fingerprint” for the element hydrogen aligned with the colored lines in hydrogen’s emission spectrum, and likewise may be used to detect the presence of hydrogen in gas samples through which white light is passed. These dark spots in the spectrum are akin to “shadows” cast by molecules of hydrogen distributed throughout the sample gas. A solid object casts a shadow whose outline represents the object’s shape. Chemical compounds thoroughly dissolved in a solution, whether liquid or gas, casts a shadow whose attenuated wavelengths represent the compound’s identity.
Usually, in the industrial analysis, we are more concerned with the quantifiable presence of certain compounds in a process sample than we are in the presence of certain elements. Fortunately, molecules also have their own distinctive interactions with light. Sometimes, these interactions take the form of molecular electrons being boosted into higher energy levels, much the same as with individual atoms. Other molecular-optical interactions take the form of vibrations and rotations set up between the atoms of a molecule, usually with photons in the infrared range. As an infrared photon of the correct wavelength (energy value) strikes an appropriate molecule, its frequency resonates with the bonded atoms, almost as if they acted as miniscule masses connected together by coil springs. This causes a transfer of energy from the photon to the molecule, where the vibration eventually dissipates that energy in the form of heat.
Thus, shining light through a sample of process gas, and analyzing the wavelengths absorbed by that gas sample, can provide quantitative measurements of the concentrations of certain gases types in that sample.
A few different infrared absorption spectra for common industrial compounds are shown here, with the frequency shown in units of wavenumber (the number of wavelengths per centimeter). It should be noted that these absorption spectra are not drawn in scale to each other; rather, they are each drawn to their own scale to better show the relative sizes of the different absorption “dips” across the spectrum for each substance:
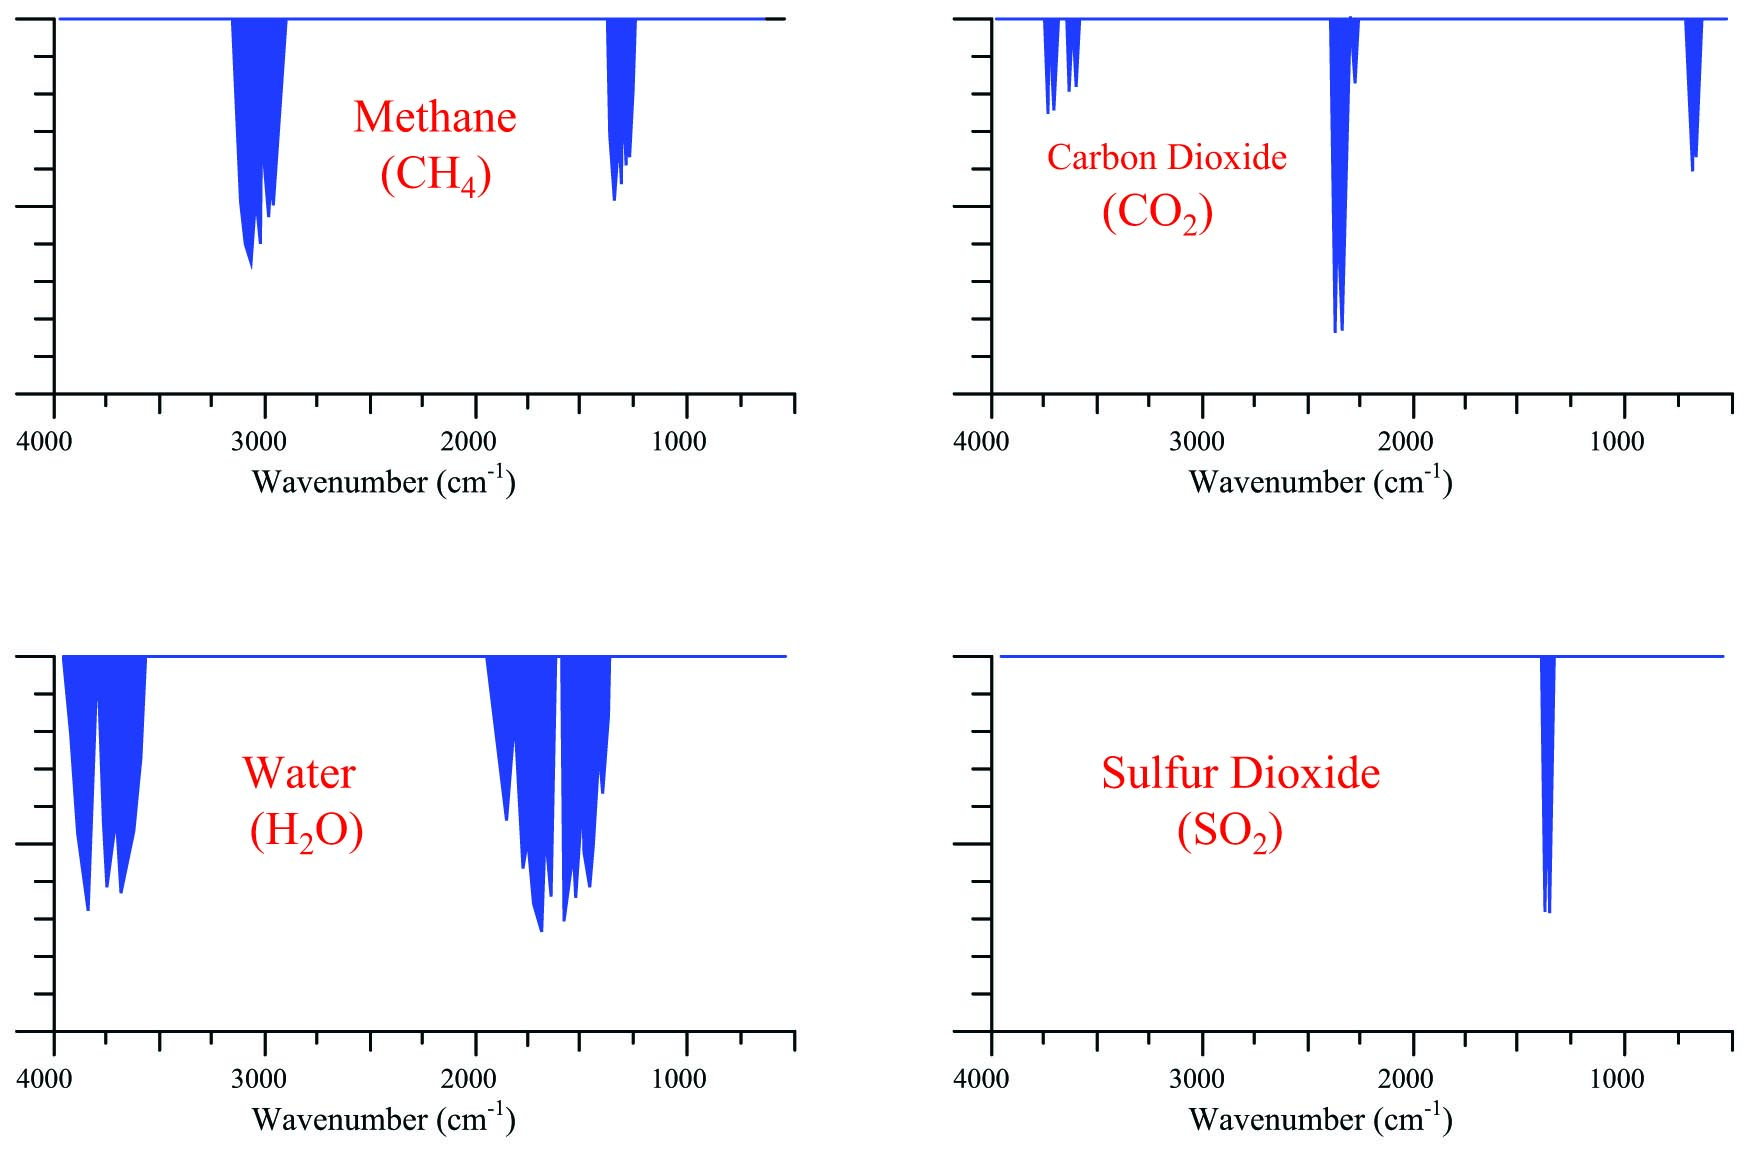
Note that the pattern of each absorption spectrum is unique. Each compound tends to absorb infrared light in its own way, and these “signature” absorption patterns provide us with a means to selectively identify the presence of various compounds in a process fluid sample.
Molecule types most effective at absorbing infrared light are those comprised of different atom types, such as carbon monoxide (CO), carbon dioxide (CO\(_{2}\)), sulfur dioxide (SO\(_{2}\)), water vapor (H\(_{2}\)O), and oxides of nitrogen (NO\(_{x}\)). Molecules formed of two identical atoms such as molecular oxygen (O\(_{2}\)), nitrogen (N\(_{2}\)), and hydrogen (H\(_{2}\)) exhibit negligible interaction with infrared light. This is a fortuitous quality of infrared analysis because many process monitoring applications focus specifically on the former compounds to the exclusion of the latter. Monitoring the exhaust emissions of a large combustion system, for example, is an application where the concentration(s) of CO, CO\(_{2}\), SO\(_{2}\), and/or NO\(_{x}\) are relevant but the concentration of nitrogen (N\(_{2}\)) is not. As with all chemical analyses, the key to selectivity is to find some property of measurement applicable only to the substance you are interested in measuring and not to any others. This how analytical instruments discriminate between the substance of interest and the other “background” substances.
Between optical emission and optical absorption, absorption analysis seems to be more popular in modern industrial use, with optical emission analysis limited mostly to laboratory applications. One reason for this is the necessity of heating a sample to a high enough temperature for it to emit light: an energy-intensive and potentially hazardous endeavor. Absorption analyzers need only shine a beam of light through an unheated sample chamber, then measure how much of specific wavelengths were absorbed by the sample. Another important reason for the prevalence of absorption analyzers in the industry is the necessity of a sophisticated computer and algorithm to sort the line spectra of substances generated in emission-type analyzers. Inventors have devised clever ways to quantify the absorption spectra of different process substances without resorting to automated pattern-matching of spectra.
In every absorption-type optical analyzer, the fundamental equation relating photon absorption to substance concentration is the Beer-Lambert Law (sometimes called the Lambert-Beer Law):
\[A = abc = \log \left({I_0 \over I}\right)\]
Where,
\(A\) = Absorbance
\(a\) = Extinction coefficient for photon-absorbing substance(s)
\(b\) = Path length of light traveling through the sample
\(c\) = Concentration of photon-absorbing substance in the sample
\(I_0\) = Intensity of source (incident) light
\(I\) = Intensity of received light after passing through the sample
A typical arrangement for exposing a fluid sample (liquid or air) to light is shown in this diagram:
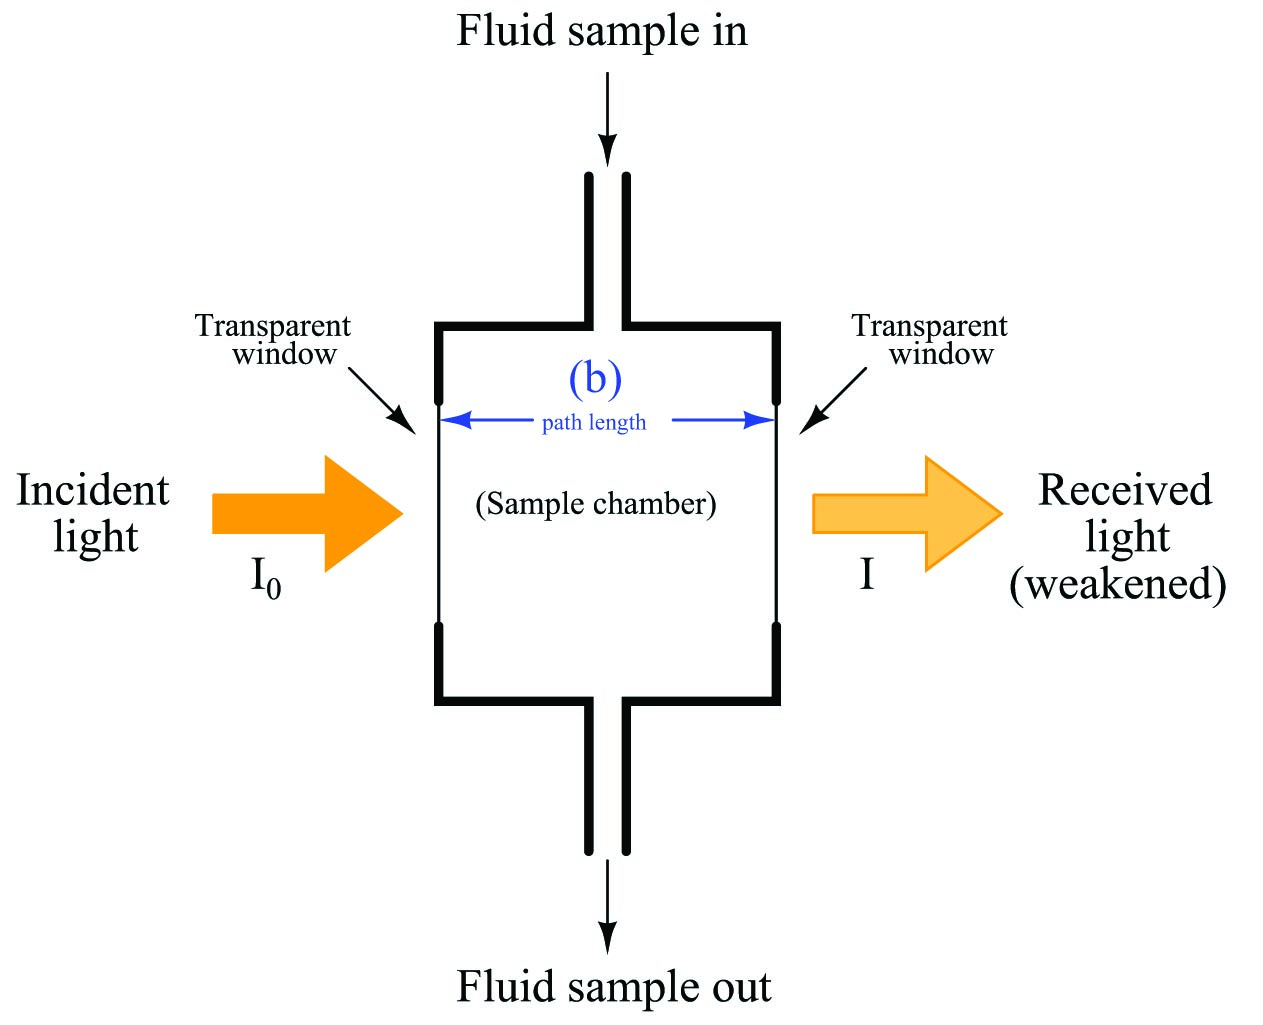
As indicated by the Beer-Lambert equation, greater sensitivity will be achieved with a longer path length. In some applications where the substance of interest is an atmospheric pollutant, the light beam is simply shot through open-air (usually reflecting on a mirror) before returning to the instrument for analysis. If the light source happens to be a laser, the distance may be quite large.
Once the light has been passed through (or reflected off of) the process sample, it must be analyzed for attenuated wavelengths. Two major types of wavelength analysis exist: dispersive (where the light is split up into its constituent wavelengths) and nondispersive (where the spectral distribution of the wavelengths is detected without separating colors). These two optical analysis methods form the subject of the next two sections.
