Facebook
 Google
 GitHub
 Linkedin
Scaling Values: Linear Versus Non-Linear Changes
Scaling values has a wide range of applications and helps to match output values to their real-world applications. Most scaling is linear, but many of these real-world changes are not quite so simple.
Computers don’t understand numbers like we do in the real world. Most variables around us, such as temperature, pressure, and distance, these are all easily understood with common units like degrees, feet, or pascals. When we try to input these values into a digital system through the use of sensors, the value from the sensor must be converted, or scaled, into a useful, readable value.
Scaling Values
In nearly all programming applications there are methods for creating functions to scale values. Scaling values has a wide range of applications and helps to match output values (like a numeric display on an HMI, or a transmission to a cloud data storage) to their real-world applications. PLCs usually have their own programming blocks for scaling values for inputs or outputs.
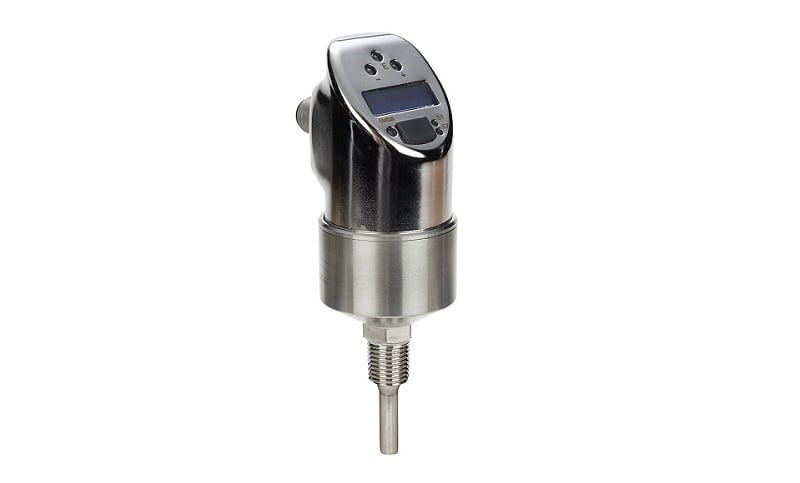
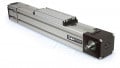
Figure 1. Analog output (4-20 mA) temperature sensor. Image used courtesy of Automation Direct
Most functions involve linear scaling, often following the slope-intercept equation form y=mx+b. There are other less common nonlinear scaling functions that are capable of creating values to fit nonlinear applications. In order to better understand the application of nonlinear functions, this article will first give a brief overview of linear scaling before looking into the application and functionality of nonlinear value scaling.
Linear Scaling Functions
In the context of linear scaling in a PLC control system, these machines often have scaling command blocks to be inserted into a ladder logic program. These programming blocks have a high and a low input and a high and a low output. Many PLCs also have the ability to use written functions (structured text) where outputs are computed through an equation written specifically by the programmer.
Automated cells often have many different sensors to monitor changes within the cell. These sensors send outputs to a PLC or a robot to be used for the cell’s processes. The signal for analog sensors can be sent as either a voltage or a current range. Since the output of this type of sensor will often be linear, a linear scaling method will work to adjust values for use in the controller.
An example of a linear scaling scenario can be seen in tank level measurement. If the tank has completely vertical sides, then the height of the liquid in the tank has a linear relationship with the volume of liquid in the tank. A laser distance sensor can be used to detect the level of liquid in the tank. If the laser is pointing down onto the liquid from the top of the tank, then the sensor will output a linear set of values to the control unit (either a robot or PLC). The control unit then takes these output values and scales them to be of use to the system.
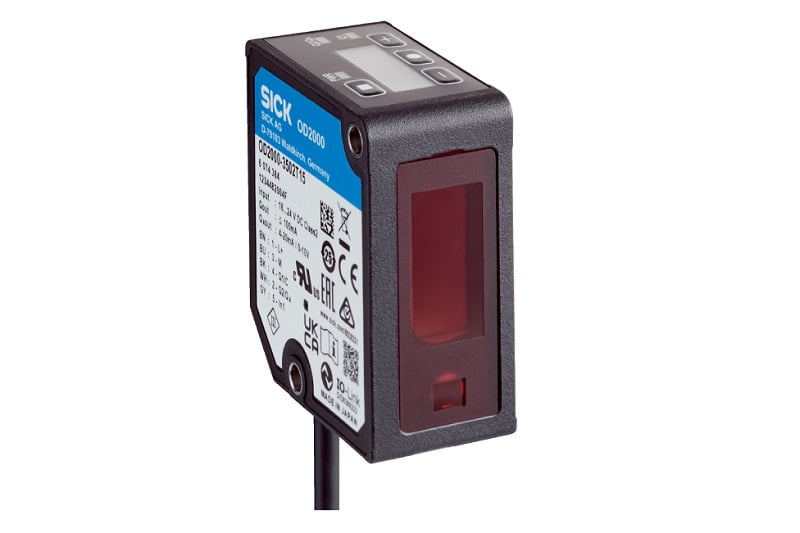
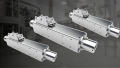
Figure 2. Analog output (voltage/current) laser distance sensor. Image used courtesy of SICK
If the sensor outputs 4 mA when the tank is full, a value can be assigned in the program that reflects this information. When the tank is empty the sensor will output a value that is higher than 4 mA since the laser will be reflecting from farther away. If the output value of an empty tank happens to be 10 mA, this output value can be assigned to show the tank is empty. With the high and low values assigned, the control program can now scale the values appropriately when it receives a signal anywhere within that range. If 7 mA is output from the sensor, the PLC will calculate a value that shows the tank is now half full.
Nonlinear Scaling Functions
Exponential
In some instances, a linear set of output values will need to be scaled nonlinearly. There are a multitude of reasons for this type of nonlinear scaling. Consider the volume of liquid in a conical tank instead of a cylinder. The volume of a conical tank based on height is expressed as an exponential equation.
If we use the previous example of a tank holding a liquid but change one of the parameters, we can better understand a nonlinear scaling scenario. Let’s assume the same variables for the scenario, a laser distance sensor that is used to measure the liquid level in the tank. When the tank is empty, the sensor sends an output of 10mA following the previous example. When the tank is full the sensor sends an output of 4mA. The difference between the linear example and this nonlinear example is the shape of the tank. In other words, the height of the tank is the same, but the width changes in relation to height. We will assume the tank is conical with the top having a larger radius than the bottom of the tank.
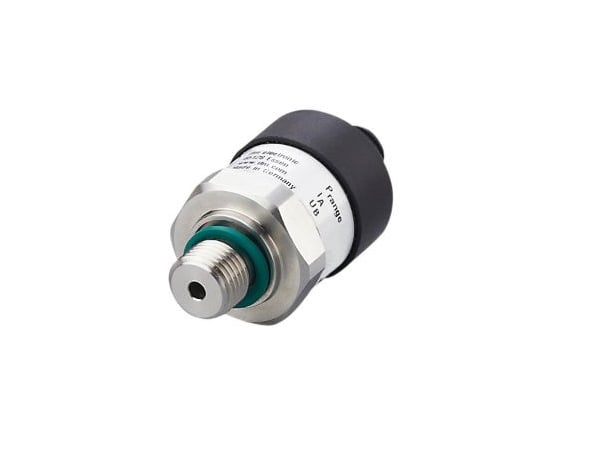
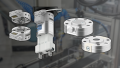
Figure 3. Analog output (4-20 mA) pressure sensor. Image used courtesy of ifm
In order to output the volume of the tank correctly, PLC/robot will have to scale the values nonlinearly. Since the shape of the tank is conical, a deceptive liquid height of ½ full does not produce a volume equal to ½ full as in the cylindrical example. PLCs often have a nonlinear scale block that can be added into the ladder logic which will accept many input and comparable output values to create a mathematical function that is more accurate for all values between minimum and maximum. This block gives PLCs the same benefits as high-level textual programming for mathematical operations.
In a PLC, it is common to find both linear and nonlinear scaling function, but linear is more common. For any PLC that is capable of STL (structured text) programming, the designer can choose whatever scaling model best fits the situation.
Logarithmic
Logarithmic scaling can be of use when values of vastly different sizes need to be scaled together. A logarithmic scale allows room for values of different sizes to be used in a closer relationship than other scaling methods. In order to better illustrate how this works, imagine a theoretical scenario where a robotic process has benchmarks for different production values that need to be graphed and displayed visually for the cell operator. The operator uses the graph to make decisions on what to do next when working in conjunction with the system. Perhaps the three output values that need to be graphed are 100,10000, and 1000000.
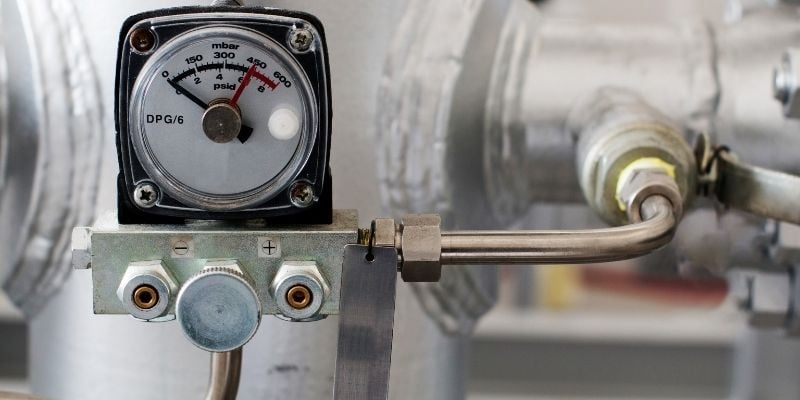
Figure 4. Analog values can be shown on gauges but must be scaled when converted to digital quantities. Image used courtesy of Canva
If those three values were to be graphed using a linear scale, they would be so far apart that they would not fit together well on the screen and the operator would have a difficult time gaining the correct information. The value of 100 would appear to be way at the very bottom of the screen. By scaling the input values using log base 10, the values can then be graphed in a much more manageable way. With a base-10 log, the values of this production test become 2,4, and 6 respectively. These values are much closer together and are able to relay the appropriate information to the operator. PLCs and written code can be used to scale values logarithmically using the same methods described earlier, but using a logarithmic function instead.
Summary
There are many different scenarios where values need to be scaled. The type of scaling greatly depends on the type of data being input into the PLC or control system. Most of the time, a linear scale is appropriate where a high and a low input are matched to a high and a low output. The two scenarios given for nonlinear scaling are simple, and as we know, real-world application is often not so simple. But the practical use of nonlinear scaling can be seen from the examples.