Facebook
 Google
 GitHub
 Linkedin
What is Statistical Process Control (SPC)?
Learn how statistical process control (SPC) can provide a foundation for decisions used to reduce waste and increase efficiency in the manufacturing process.
Statistical process control (SPC) is a method of reducing waste scrap, rework, and quality excursions in a production facility. It uses statistical tools to predict when product parameters may go out of specification so that appropriate corrective actions can be taken. SPC is about pattern recognition and looking for trends in data, as well as managing any changes to processes to ensure that process integrity is maintained across all stages.
For example, suppose an injection molding facility tracks the amount of flash that must be removed from a mold after injection using an integrated scale. The flash removal is occurring regularly, and the product is still saleable, but the amount of flash generated from one mold is steadily increasing.
Without SPC, the line will continue to operate until parts go out of specification and must be scrapped. The line is shut down for an unplanned maintenance stop and the mold is replaced. With SPC, the engineer tracks this steady increase. Rather than waiting until failure, the engineer makes a note to replace the mold at the next regularly scheduled maintenance shutdown. No scrap is generated, and no unplanned outages occur.
While this sounds simple, developing SPC in a production facility takes time and data. Many facilities find they are not collecting the required data and must add sensors and database capability. Often, this is performed as new automation equipment is added.
The four basic pillars to SPC are data collection, SPC charts, the Continual Improvement Process (CIP), and Design of Experiments (DoE). There are nuances to each of these, and each engineer who practices SPC will have their own methodology. A mature technology, such as foundry work, may not place much emphasis on DoE, as there is little need to make major changes to the process, but may emphasize CIP to bring down energy costs. A pilot-scale semiconductor manufacturer will spend most of their time in DoE to make sure they can roll out operating instructions to the production-scale facilities.

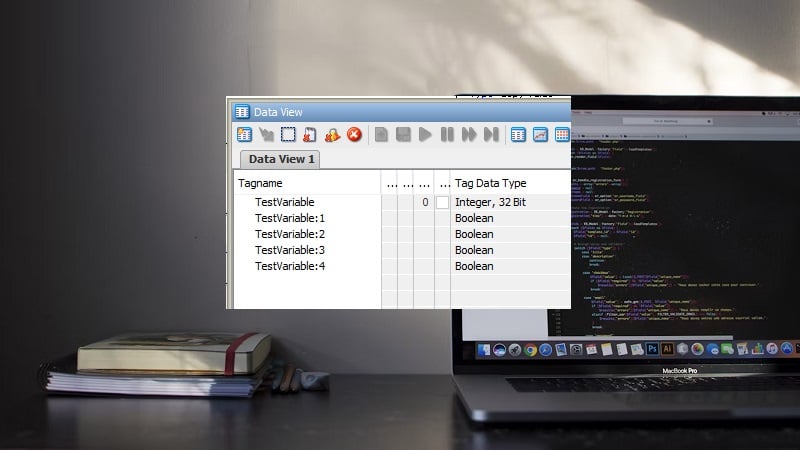
Figure 1. SPC involves collecting and logging data, automatically in most cases, in order to make decisions.
Data Collection for SPC
Data collection encompasses everything from technician notes to measurements on products to process equipment parameters. Sensors and quality control measurements are used, but potential problems must be noticed before quality control catches the issue. Therefore, machine parameters, such as process pressures, temperatures, current, and vibration are tracked. This data may go unused until concerning trends or quality excursions occur. However, having the data available to help with troubleshooting is much better than making decisions on limited data, often leading to incorrect assumptions.
SPC Charts
Once the data has been collected and organized, it is converted into visual charts for inspection. Depending on the software package, they can manually inspect the charts or set limits for alarms or decision-making trees should certain trends arise. Sometimes, the seemingly obvious problem is only a symptom of a more subtle problem, or sometimes a problem is due to multiple confounding factors. Armed with the right data, the engineer can propose the proper solution.
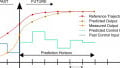
In general, SPC charts are organized by time on the x-axis and measurement on the y-axis. Called a “run chart”, this organization scheme shows how some aspect of the process has been performing historically. Each data point may represent an individual measurement or an average of measurements. Ideally, this chart would be a horizontal line, meaning a parameter has not changed throughout history, and the process is completely predictable and repeatable. However, reality shows us that this is never the case. Instead, the process varies slightly requiring limits for how much variation is to be tolerated.

Figure 2. A run chart, plotting the miles per gallon (MPG) in the author’s car. The big step change could be due to an oxygen sensor failing, a change in driving habits, or another issue requiring investigation.
Besides the run charts, there are also “sigma” charts. The sigma charts show time on the x-axis and the standard deviation from the mean on the y-axis. Ideally, these charts would be a horizontal line at “0”, meaning there was no variation, but once again, there will always be some variation in every real process. Sigma charts are often viewed at the same time as run charts, because a quality excursion may not be evident on the run chart.
Control limits are specified on both types of charts. The control limits are governed by rules established by the engineers to alert them of potential problems. It could be that the control limits on a sigma chart are simply +/- 3 sigma away from the mean, indicating a defective product. To truly benefit from SPC, more rules are required so that actions are taken earlier and no defective products are manufactured.
Continual Improvement Process (CIP)
When the process is running smoothly, the data can drive improvements. However, processes should not be changed haphazardly, but rather experience a documented change process. Typically, CIP is implemented to make incremental changes to reduce or increase some parameter that will affect the entire process.
CIP is evaluated on the basis of how it affects the entire process. Sometimes, it makes better financial sense to allow one part of the process to operate less efficiently, because to change it would affect a more important part of the process.
For example, a crayon manufacturer notices that the crayons are not molded with perfectly symmetric tips. If they implement a certain change, the tips will be more symmetric, but the cost of the crayon will increase by 30%. The reality is that the children using the crayon will quickly make the tips non-symmetric, and so the tiny defect is not worth fixing, especially if it drives up the overall cost significantly.
Design of Experiments (DoE)
Besides minor process changes, major process changes rely on well-designed test experiments. Experiments must be designed carefully to ensure that the data collected is accurate and models the end result of the process.

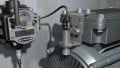
Figure 3. Even a small process change (in this case, only 2 degrees F) can result in major quality impacts between parts. All experimental changes should be carefully controlled and documented.
DoE is as much an art as it is a science. In general, experiments must be screened to determine valid process parameters, experiment order randomized and checked. Furthermore, results should be checked using more advanced statistical methods to ensure that the process change is statistically significant. Finally, accounting or financial personnel should be consulted to ensure that the change is financially sound.
Summary
All of this is merely scratching the surface of SPC implementation. Each piece of the SPC improvement process requires careful balancing between collecting and analyzing data versus the cost of implementation. By thinking about how each of these four pillars of SPC interact, one can begin to plan how to integrate an SPC approach into their facility.