Facebook
 Google
 GitHub
 Linkedin
Understanding the Relationship Between Precision and Accuracy
Learn more about the relationship between accuracy and precision by diving deeper into the concept with an example based on a company's machine production.
In the introduction article, we took a graphical look at the concept of accuracy, precision, and resolution. We based our thoughts on typical charts that we often see in attempting to explain the differences and relationship between these concepts, but we took it one step further by introducing how resolution influences both accuracy and precision.
The problem remains that pretty pictures are great, but they do not really give us anything tangible to compare other processes to. Here, we dive a little deeper into this concept with an example.
A Quick Review of Accuracy, Precision, and Resolution
Before we go too far, let’s review the basic graphic we started with last time, though this will all consider everything at constant resolution initially.
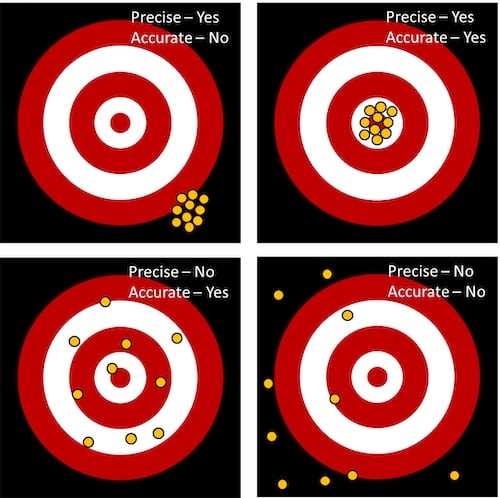
Figure 1. The relationship between precision and accuracy.
As you look at these charts what do you see? How can we begin to pull this into something more useful? A couple of things that should immediately pop out, particularly with either of the precise charts. We see that there is a very small variation from group to group. Variation can be expressed in a few different ways mathematically: as a range, as a plus/minus value from some reference point, or statistically as a sigma value. We will build on this concept here in a moment, but first, we need to contrast those two charts to understand accuracy.
What Role Does Accuracy Play?
Accuracy is a combination of two simple mathematical principles. The first is the average, and the second is the variance from average.
Accuracy is defined as the average and its relation to the expected output. We see this in the chart where precision is not high but it is stated to be accurate. The reason for this is that when all the points are averaged in Cartesian space, that value puts it right in the center. The problem with this one is that there are very few points that are there in the center. In contrast, when we increase our precision, we notice that the overall average has not differed much visually, but the points are clustered together in a much tighter pattern.
Expressing this in a fashion that combines each of these concepts is rather simple and is shown in Figure 2.
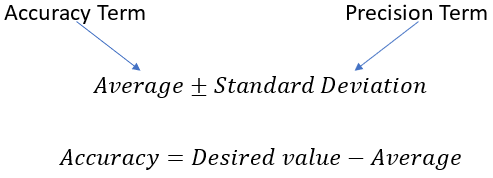
Figure 2. The concepts of accuracy and precision in a simplified graphic form.
While I wrote standard deviation, one might also use the range of differences from the average, similar to how a mechanical drawing is toleranced. One does not need to go down the full path of tools like Six Sigma to be able to benefit from this. While they are a tool to help dial in even better on process variation, we can take small steps to get there.
Differentiating Good and Bad Values
Now comes the tricky part: how do I know what values for this are good or bad? This is a tough question to answer without having context and a specification or something to compare to. To do this, let us set up four examples of data. For this example, we are going to look at the data from the (completely made up but successful) ACME 3D Printing Filament company.
This company has been getting complaints about the quality of its filament. They have four different machines that should produce a filament at a nominal value of 1.75mm ±0.05. We begin by digging into the data to understand the issue a little better. To do this, we look at laser measurement gauge data for filament diameter, measured in millimeters. This data represents a measurement taken at every meter of filament, so it is not too long. We only need to look at 30m worth of data from each of the four machines (shown in Table 1 below).
Table 1. Measurements From 3D Printing Filament Production Machines

Figure 3 shows this same data in graphical form.
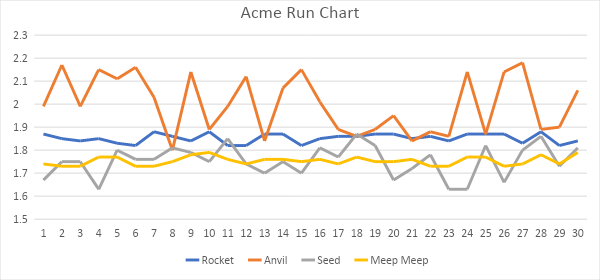
Figure 3. Filament machine production.
Here we can quickly see that we have some issues. Two of the lines, Anvil and Seed, are showing high process variation. In comparison to the other two lines, we can see the precision is off.
Looking at the standard deviation we have .12mm and .07mm respectively for each machine. This compares to Rocket and Meep Meep having standard deviations of only .02 each. The Rocket and Meep Meep lines are comparatively much higher precision than the other two lines, by almost an order of magnitude.
We have identified which machines are comparatively precise, but what about accuracy? Visually, accuracy is slightly less intuitive. In this case, the Seed and Meep Meep lines are more accurate than the Rocket and Anvil lines. Seed and Meep Meep have an average diameter of 1.75mm whereas the other two lines are 1.85mm and 2.00mm, respectively.
Which line is the overall winner? The Meep Meep line is by far the most accurate and precise. The worst line belongs to Anvil. It is stopping up the works in this factory.
Which line would I rather start working on to fix? Probably the Meep Meep line. Wait, you might say, I thought that this line was the best. Well, yes, it is the most precise and accurate, but it looks like we might only have a little better than a ±2sigma process. If we want to get to ±3 sigma, we have work to do. From there, I would then work on the Rocket line as it has a consistent offset. The other two lines with their high levels of variation will likely require more head-scratching to understand the different sources of variation.
While this article helped us wrap our heads around precision and accuracy a little better by going from concept to application, we still need to bring in a better understanding of the sensors and how they affect our attempts to control a process. In the next article, we will take a deeper look at this topic. Until then, what stories do you have to share about troubleshooting processes with issues of accuracy and precision? Please share them in the comments below.
Related Content