Facebook
 Google
 GitHub
 Linkedin
SPC Pillar: Data Collection
Statistical process control (SPC) is meaningless without the proper collection and analysis of data. For some process parameters, this is a simple task. But not every part of a process is driven by simple, quantitative parameters.
In part 1 of this series, we explored the fundamentals of SPC.
When a manufacturing plant begins to implement SPC, one of the most challenging first steps is determining what data is currently collected and what further data needs to be collected. Sometimes this involves going through paper files for legacy technology or managing multiple internal databases compiled by various engineers. All of the data collected must be converted from paper records and tribal knowledge into a standard, digitized set.
With the cost of sensors dropping, many pieces of industrial hardware are already outfitted with numerous sensors for product quality and machine diagnostics. Given this increased instrumentation available, engineers are spending more time sifting through data than figuring out how to collect it.
Impact of Sensor Technology
In the early days of SPC, statistical methods were hindered because of the lack of data. Sometimes this was not collecting enough data points on a particular parameter, and other times it was not having a reliable method to collect the data required, substituting “data by proxy” instead.
In the first case, picture a casting operation that produces cylinder heads for engines. To determine the porosity of the casting, they destructively test a few and use those data points to make assumptions about the rest of the lot. The engineer’s job was to determine how many samples must be destroyed to assume accurate data.
In the second case, an industrial thermal spray operation applies one coating, stops, checks the thickness with calipers, then sprays again until the desired coating thickness is achieved. This process is time-consuming, potentially dangerous, and introduces thermal stresses in the coating. Instead, the “work-around” was to monitor gas flow rates and coating powder consumption, and assume that everything behaved properly unless quality control said otherwise.

Figure 1. Thermal spray coating process. Image courtesy of A&A Coatings
With improved sensor technology, both of these cases can be addressed. In the first case, many techniques such as ultrasonic or dye testing have been developed so that fewer castings must be destroyed, but more castings tested in a non-destructive manner. This yields more data points leading to better analysis, as well as higher product yield.
In the second case, laser distance sensors can measure the coating thickness during spray coating. Not only will the coating have a uniform thickness with fewer quality excursions, but the thickness and spray time can be compared against powder usage to see if there is a feeding problem, or whether some powder is being lost in the process.
All of these tools can be integrated into the SPC data management system, logging records much more quickly and accurately than a human. Ideally, the data is stored on the company’s cloud for retrieval and review from any location.
Qualitative Data
If a property can be quantified, it can be tracked with SPC. Qualitative measurements are much harder to track, but some of these measurements can actually be quantified by machine. Paint tint, for example, sounds qualitative. An experienced painter can tell the difference between “pure white” and “simply white”, but to the untrained eye, the two colors may appear exactly the same, making it seem like a simple matter of personal judgment.
How could you quantify paint tint? With machine vision, of course! Modern optical sensors can determine the RGB values and match the tint. A feedback loop can manage tinting agents by adding them relative to the recorded RGB values. SPC can monitor this feedback loop and decide if there is a reason the amount of one tinting agent is being used up more quickly than historical records predicted.
Some data can be collected qualitatively and assigned a number for SPC purposes. For example, at a large cheese manufacturing plant, cheese can be “graded” based on taste. There isn’t a good way to quantify taste objectively other than to have multiple people taste the cheese and assign a number to it, then average the values.

Figure 2. Cheese quality grading. Image used courtesy of Jakub Kapusnak on RawPixel
All data should be evaluated for patterns, particularly if the product is difficult to quantify objectively. In the cheese example, besides averaging numbers, the evaluators themselves should be evaluated using statistical methods. Does one evaluator consistently rate all of the cheeses lower? If this isn’t checked, the quality of cheese may mysteriously increase on his days off, then drop when he returns.
Equipment Parameters
Besides product specifications, tool parameters can also be tracked in newer process equipment. With a well-managed data set, tool parameters can also be an early indicator of upcoming issues, leading to the popular study of predictive maintenance.
For example, suppose the temperature of a metal bandsaw blade is recorded while the machine makes rough cuts. It makes these same cuts every day. Over time, the temperature of each cut begins to increase. This is due to increased friction on the blade, a sign that the blade is getting dull. Once again, the process engineer can spot this trend and submit a request for blade replacement at the next maintenance cycle, rather than waiting for the blade to break.
Another example is to track the current draw on electric motors. Suppose a pump is moving a chemical from a storage tank into a reactor, and the current drawn by the electric motor is tracked. Many pumps have a feedback mechanism ensuring that the same outlet pressure is maintained; if the outlet pressure drops, more current is applied to the motor. Over time, the rotor in the pump wears which leads to decreased outlet pressure. The motor compensates by drawing more current. Without SPC, eventually, the thermal overload relay will trip on the pump due to the high current. It will be an unplanned outage and require emergency maintenance. With SPC, the current increase would be noted and perhaps alarmed before the breaker tripped. This would give plant engineers time to adjust the process and prepare to take the pump out of service with a planned outage.

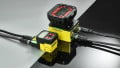
Figure 3. Sensors near motors can detect problems based on vibration, temperature, and current draw. Image used courtesy of Banner Engineering
Data Collection with Analysis in Mind
For the most part, all data is good data, provided it is collected and analyzed properly. Every piece of the data collection process should be documented so that trends can be verified. If a sensor is replaced, its data should be compared against the previous sensor’s data (when it was functioning properly) to ensure that the new sensor is a good replacement, and any slight changes can be calibrated if needed.
Summary
Full data analysis is an art in itself, and new techniques are being developed every day. As a plant engineer or technician, collecting data and taking detailed notes can maximize the time between quality excursions and greatly assist troubleshooting efforts.