Facebook
 Google
 GitHub
 Linkedin
LabVIEW Environment Deep Dive
Graphical programming language LabVIEW uses front panels, block diagrams, a controls palette, and a functions palette to design control systems. Let’s take a deep dive into each of these and their functionalities.
What is LabVIEW?
LabVIEW by NI is a simple yet powerful graphical programming language used in research, academia, and industry. It is well-suited for instrumentation, data acquisition, and process control applications.
LabVIEW is a graphical language, as opposed to a text-based language, such as python or C++. Instead of typing out lines of code, LabVIEW programs are visual, with symbols, boxes, and virtual wires.
As algorithms are to written programming languages, flowcharts are to LabVIEW. Learning and understanding LabVIEW programs is relatively easy, as the code itself paints a picture of its functionality.
Instead of tracking data with variables throughout lines of written code, data flows along virtual wires; in an instant, the programmer can see every place the data is used or manipulated. Instead of searching for brackets to indicate the end of a loop, as a text-based language requires, code blocks are inside or outside a visual loop on the screen.
The original intention of LabVIEW was to replace benchtop hardware, such as oscilloscopes, digital multimeters, and function generators. Therefore, the programs in LabVIEW are called Virtual Instruments, or VIs. These VIs consist of two pieces: a front panel and a block diagram.
Front Panels and Block Diagrams
Front panels are what the user sees. They are often designed to look like the benchtop hardware that they replace. The front panel is the graphical user interface (GUI) where an operator, graduate student, or researcher interacts with the program. It typically includes indicators, controls, graphs, warnings, and other relevant information that the software operator will need to see.
Block diagrams are where the LabVIEW code actually lives. The LabVIEW programmer will place loops, subroutines (Sub-VIs), timing, file manipulation, decision-making structures, math, and so on in the block diagram. The VI user does not necessarily need to see the block diagram to use the code, but will feel its effects—just like an oscilloscope operator will watch the display, but does not necessarily program the microprocessor that runs the oscilloscope.
For most VIs, a front panel and a block diagram are both required. When the programmer saves the file, they are saved to the same file, with extension .vi.
The Front Panel and the Controls Palette
Developing the front panel requires the programmer to drag components, such as controls and indicators, from the controls palette onto the front panel. The programmer has all sorts of options for placing these items, as their connections in the block diagram will dictate their interactions. Therefore, it is good practice to design the front panel to look like whatever benchtop instrument it replaces.
Consider a simple thermocouple reader. A typical thermocouple reader has a power button, a digital temperature display, and a units switch to select degrees Fahrenheit and Celsius. The power button is a boolean control, as it only has two states (on and off). The digital display is a numeric indicator, and the units switch is another boolean switch. The programmer can pick the styles of each of these, and the rich library of graphics allows for customization, as well as easy documentation and labeling.

Figure 1. The controls palette, and the controls palette with “modern” and “numeric” selected.
Items in the controls palette are sorted by the style and data type they handle. Clicking on “modern” reveals multiple data types, such as numeric, boolean, graphs, and so on. If the programmer wants to handle numeric data, they can click “numeric” and are presented with multiple ways to collect and display data.
The programmer should choose the option that most represents the situation. For example, the thermocouple reader could display a simple number, or it could also display the thermometer icon to represent the temperature graphically.
The Block Diagram and the Functions Palette
The block diagram is where all of the “code” lives. Loops, control and decision-making structures, mathematical functions, comparisons, file handling functions, and so on are placed in the block diagram.
Each icon placed on the front panel (other than “decorations) will place an icon on the block diagram as well. This is how data enters and leaves the display for manipulation, recording, or is used for decision-making in the code. The programmer does not have to place these icons separately; LabVIEW does this automatically.
Unlike text-based programming languages that require variables for data, data flows through wires that the programmer draws between terminals. At a glance, the programmer can see whether data is connected to the correct places, rather than debugging variable names.
Besides wires and icons placed as an interface to the front panel, the programmer can add icons in the block diagram to handle program flow. Loops, control elements, file elements, and so on are found in the functions palette. The functions palette is to the block diagram, as the controls palette is to the front panel.

Figure 2. The functions palette with “programming” open, and the functions palette with “programming” and “structures” open.
While the controls palette icons are relatively self-explanatory, the functions palette icons are a little less intuitive. However, both palettes display a brief text description of the icons to help the beginning programmer learn each item. For example, in figure 2 above, the top left icon is a “for loop,” and the top middle is a “while loop.”
It is also worth noting that the options under the functions palette will vary with the additional packages installed. For example, the “Control & Simulation” or “FPGA Interface” will only be present if installed.
Controls Versus Indicators
Notice that some components receive input from the user, and some display data to the user. Items such as buttons, knobs, switches, and dials are known as controls in LabVIEW, as the user controls their value.
The items that display data, such as LEDs, graphs, and gauges, are called indicators, as they indicate the value of data. A few items, such as text and numeric boxes, can be either a control or an indicator, but never both simultaneously, and must be specified before the VI will run.
On the block diagram, controls will have an output terminal on the right side of the icon. Indicators will have an input terminal on the left side of the icon.
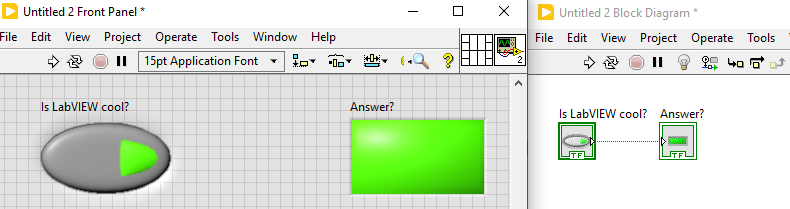
Figure 3. This simple VI shows a front panel and a block diagram next to each other.
When the VI runs, the user presses the button (a control) to decide whether they think LabVIEW is cool. Data flows (true, in this case) from the right terminal, through the wire into the left terminal of the LED (an indicator). Notice that the control and indicator on the front panel each have an icon in the block diagram.
The LabVIEW programming environment may be a little foreign to the text-based programmer. However, with some practice, it becomes an intuitive language capable of producing easy-to-understand GUIs for equipment operators and researchers.
Related Content