Facebook
 Google
 GitHub
 Linkedin
Control and Visualization of Power Plant Data Through SCADA Systems
The control and visualization of power plant processes through SCADA improves the supervision, coordination, and security of the power system operations.
The basic objective in the operation of a power system is to maintain a state of balance between production and the consumption of electrical energy. The power systems are expanding as a result of the interconnection of regional systems, and day by day, increasing consumption of electric energy and any disturbance in the system will have far-reaching effects on the power system. It is, therefore, necessary to improve the supervision and coordination of the various parts of the system in order to increase system stability and economy in the power system operations. Thus, the operator needs instant information about the actual power system status.
Information about the power system is collected by the data acquisition system (DAS). The acquired power system data has to be monitored for changes. If a monitoring function detects a change or limits violation, the event processing function is activated and the event list may be presented to the operator.
Why Remote Control Systems?
In order to help the operator find the optimal way of operating the power system, they need a system that can:
-
Present an overview of the power system and information that is complete, correct, and valid.
-
Display the data and information in such a way that the operator understands it and discovers abnormal situations as early as possible.
-
Use electrical power flows (active, reactive) in the system.
-
Generate alarms when specified values are reached with their limits.
-
Command such as breaker operations, set point control, etc.
-
Report on a daily, weekly, and yearly basis.
The remote control system should give the operator a good and reliable picture of how the power system is operating at all times.
How Do Power Systems Work?
When we consider a power system network, the load connected to the power system network continuously changes. If the load is an inductive load, then it draws both active and reactive power from the power system source. In the real world, when both residential and industrial loads are connected, the alternator or generator produces active and reactive power in response to change in load.
First, understand the basic relationship between frequency (Hz), active power, voltage, and reactive power while delivering power in the system. As in Figure 1, when the demand for active power in the system increases, the frequency drops and the generator speed will depress. In other words, the turbine speed decreases. In order to run the generator at a constant speed, the governor system takes control—it increases the amount of water by further opening wicket gates allowing the additional flow of water. This provides more force to run the turbine at a constant speed. When the system frequency is high, the generator is producing more active power in the system and the governor system will reduce the opening of wicket gates to decrease the flow of water so that machine turbines will not over speed.
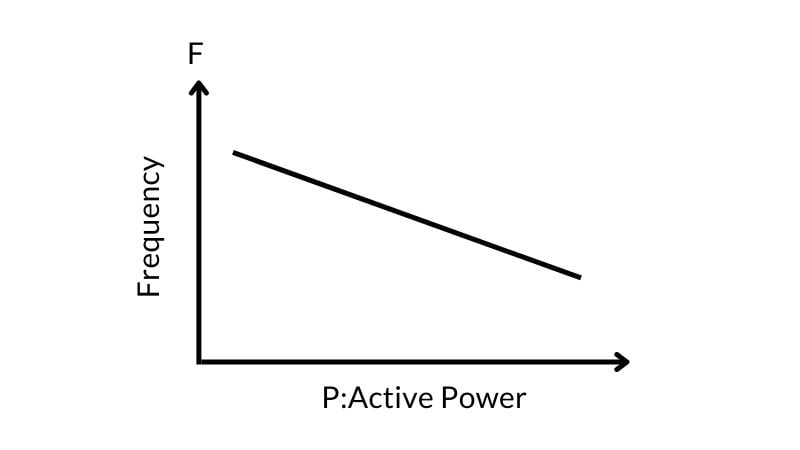
Figure 1. Frequency and active power graph.
The function of the governor is to regulate the water into the turbine by controlling wicket gate movements, which in turn, rotate the generator to run at a constant speed in order to maintain the frequency of 50 Hz (60 Hz in most of North and South America) when the frequency is high or low with reference to standard frequency (50/60 Hz) of the system. The governor takes turbine speed rotation (rpm) as input and adjusts water flow to maintain the desired speed.
Assume our reference frequency is 50 Hz, the reference voltage is 11 kV, and the load is connected (domestic and industrial load) to the power system. As already stated when the consumer load is high, the active power demand increases and frequency drops. Suppose the frequency drops to 49.7 Hz—now the system compares the current system frequency with the nominal frequency (50 Hz). This means the frequency is depressed, as compared to the nominal value, and additional active power is needed in the system. Therefore, the governor increases mechanical power by raising the flow of water or steam into the turbine. The more mechanical power is given, the more electrical power is produced in the system. When the system reaches 50 Hz, it reduces the flow of water into the turbine, therefore, the governor maintains the uniform frequency in the system.
When the demand for reactive power increases in the system, the voltage reduces, and the voltage sensor compares the system voltage with the system's nominal voltage. If the system voltage is 10.7 kV, the system understands that an additional reactive load is needed with the system. The excitation system controls the magnetic field in the generator and allows more current to flow through the field winding. When the magnetic field in the generator increases, the excitation in the generator increases, consequently raising reactive power in the system.
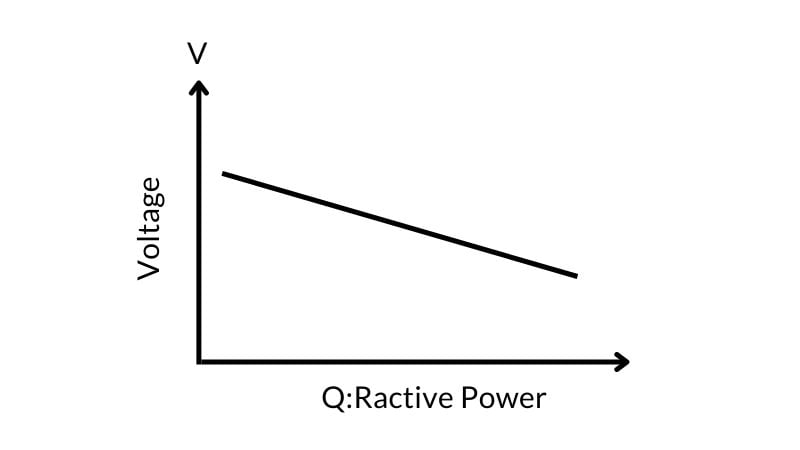
Figure 2. Voltage and reactive power graph.
The question, then, is how to maintain the system frequency, voltage, and speed of the generator within limits irrespective of load change in the system. The answer is that remote control systems like the SCADA system play an important role in automating the processes like the digital governor system and excitation control system to attain stability and efficiency in the power system.
Supervisory Control and Data Acquisition (SCADA)
A system incorporating the primary following functions is traditionally called a SCADA system:
-
Acquisition of indications: single and double indications
-
Acquisition of accumulated values: energy (MWh)
-
Acquisition of measured values: voltage or reactive power
-
Manual entry of process values
-
Process control e.g. object commands (isolator/breaker operation open/close)
-
Display event and alarms
The hardware components include field devices, controllers, computer/server, applications, and operator graphical display.
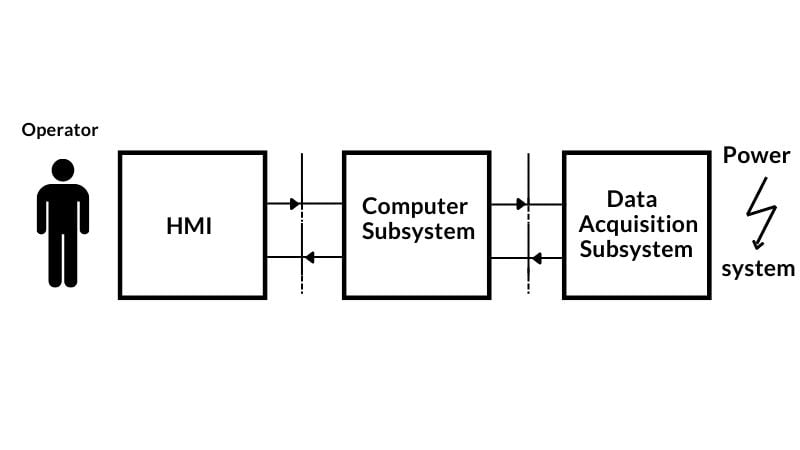
Figure 3. Subsystems of the remote control system.
Single and Double Indication Status
Status changes of the object having two states (binary objects) are called indications. There are two kinds of indications:
-
single indication corresponds to one input signal
-
double indication corresponds to two signals
The most common example of an object with double indication is a circuit breaker. For safety reasons, these devices often contain two auxiliary (aux) contacts, one open and one closed. In this way, the intermediate position of the breaker, as well as problems in the auxiliary circuits, will be detected. For double indications, there are four possible states: 01, 10 (normal), and 00, 11 (intermediate).
Indications are connected to a digital input module in the RTU/PLC. Updating a new status for indications in the point database is done when any of the indications have changed the status or the indication has been activated.
|
ON State |
In Database |
|
Single Indication |
1 |
|
Double Indication |
01 |
|
OFF State |
|
|
Single Indication |
0 |
|
Double Indication |
10 |
|
Intermediate |
|
|
Only in double indication |
11 or 00 |
Table 1. Indication values as displayed in a database. Single values can be only either 0 or 1. Double values can contain the four listed states.
Collection of Measured Values
For an analog value, the input signal to the RTU is usually a DC voltage signal in the range of 0-10 V or a DC current signal in the range of 0-20 mA. Digital measured values have different accuracy and coding, usually 8 to 16 bits. The analog inputs are connected to an analog input card in the RTU/PLC where the inputs are converted into raw values (positive or negative). All the analog measurement value channels are scanned periodically and the result is stored in the database memory for further processing. The values are stored in 8/12/16 bits: two’s complementary binary coded form.
Raw Value to Engineering Value Calculation
Suppose we measure generator terminal output voltage (Vt) using the voltage transducer (0 - 10 mA) which is used by the excitation control to maintain the voltage within the limit by increasing or decreasing the generator excitation. Let's see how to process the analog signal converted to raw value and then again into engineering value for a 13.1 kV level for the operator as in Figure 4.
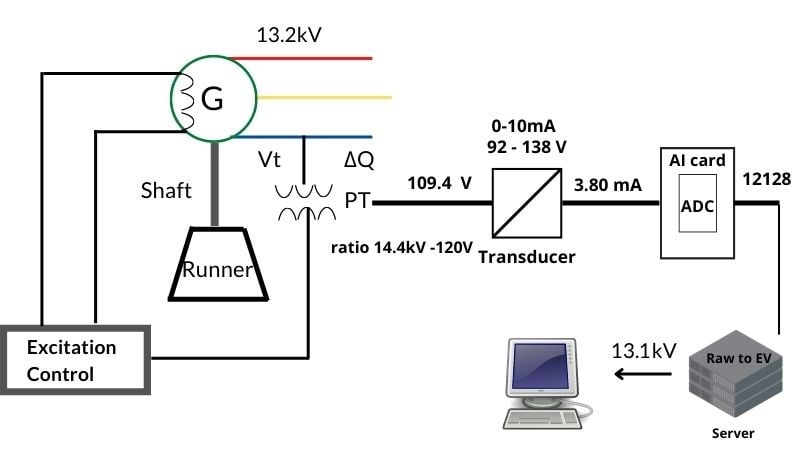
Figure 4. How to display generator terminal voltage in a SCADA system.
|
PT Ratio |
Transducer |
Transducer |
Transducer |
|
11.04 kV : 92 V |
92 - 138 V / |
109.4 V |
3.80 mA |
|
Engineering |
Raw |
Current |
Current |
|
11.04 kV |
0 - 32000 |
12128 |
13.13 kV |
Table 2. Comparison of real-world quantities produced by the physical equipment (top rows) and the digital value equivalents (bottom rows) over an actual range of 11.04 to 16.56 kV
This PT transformer ratio is a 120:1 stepdown value. With the generator's actual voltage currently reading at 13.1 kV, the voltage transducer receives 109.4 V as input, so the transducer analog signal output is 3.80 mA. In our system’s analog module, the raw value range is 0 - 32000 corresponding to the transducer’s input range of 92 to 138 V. Therefore, the span is 46.
$$PV~Range~(span) = 92~VAC-138~VAC$$
$$PV~Range~(span) = 46~VAC$$
When the maximum raw value is divided by the maximum engineering value (in this case, span), we will get the raw value per voltage.
$$\frac{Max~Raw~Value}{Max~Engr~Value~(Span)}=\frac{32000}{46}$$
$$\frac{32000}{46}=695.65\frac{raw}{V}$$
The currently reading raw value is divided by the raw value per volts to obtain the actual equivalent voltage.
$$Equiv~Voltage=\frac{Current~Raw~Value}{695.65}$$
$$Equiv~Voltage=\frac{12128}{695.65}$$
$$Equiv~Voltage=17.43~V$$
After the calculations, the engineering value is 17.43 V.
Now add 92 to this value because the transducer range started from 92 V, so the total voltage is 109.43 V received at transducer input against the primary generator voltage of 13.1 kV.
$$17.43~V+92~V=109.43~V$$
This calculation allows the controller to determine exactly how much voltage is present at the transducer when the analog signal current is 3.80 mA.
Let's consider the same example to understand the basic concept of analog scaling in PLC programming. As already mentioned, the raw value range is 0 - 32000. Now put these values into a standard linear equation as shown below to find the value “y”, which is the current engineering or process value:
$$x=Current~Raw~Value=12128$$
$$x1=Min~Raw~Value=0$$
$$x2=Max~Raw~Value=32000$$
$$y=Current~Engr~Value=Unknown$$
$$y1=Min~Engr~Value=11.04~kV$$
$$y2=Max~Engr~Value=16.54~kV$$
As already mentioned in the table above, if the secondary voltage is 92 V, the engineering value is 11.04 kV, and on 138 V, the process value is 16.56 kV. Now put the available parameters into the following equation to get the desired value of 13.1 kV as below (all voltage units in kV):
$$(y-y1)=(\frac{y2-y1}{x2-x1})\times(x-x1)$$
$$(y-11.04)=(\frac{16.54-11.04}{32000-0})\times(12128-0)$$
$$y-11.04=(\frac{5.52}{32000})\times 12128$$
$$y=2.09+11.04$$
$$y=13.13~kV$$
The application running in the server is used to convert the raw value into the engineering, which is ultimately displayed to the operator for monitoring.
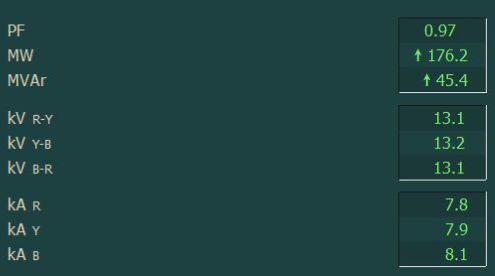
Figure 5. Realtime value of generator active power, reactive power, terminal voltages, and current.
Control Command and Regulation
Control message transmission between the master station and the RTUs can be of several types, like commands and setpoints. On-Off commands are typically used for the devices such as breakers and isolators. Check-back before execution increases the system's security. Regulation commands may be used for the operations such as the position of transformer taps or motor speed control. Setpoint (SP) command controls may include generator governors and automatic generation control.
Power System Operations
The operation, monitoring, control, and visualization of power plant processes through SCADA improves the supervision, coordination, and security of the power system operations.