Facebook
 Google
 GitHub
 Linkedin
Debugging and Variable Watch Tables Using the OpenPLC Editor
Recent OpenPLC Editor versions offer an improved debugger, allowing real-time monitoring of variables and tags in industrial control applications running on an Arduino Uno PLC.
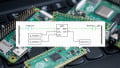
A debugger is a software tool used to investigate the internal and external operations of an embedded controller during program execution. Most IDEs include a watch feature, allowing input devices, output states, and intermediate variables to be displayed within the OpenPLC console. When an input device, such as a pushbutton switch, is activated, the corresponding Boolean value changes from FALSE to TRUE in the watch window. This real-time monitoring approach provides a clear method for observing ladder logic execution.
The new debugger introduced in OpenPLC Editor 4.1.2 provides an enhanced method for observing and analyzing industrial control applications. The importance of the debugger is that it presents a practical approach to understanding ladder diagram execution using real-time monitoring techniques. In previous versions of OpenPLC, the ability to observe internal logic states during execution was limited. Therefore, users were required to rely on indirect testing methods using physical outputs and manual verification.
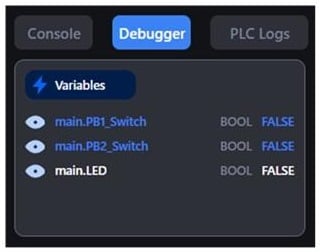
Figure 1. The Debugger Watch Feature.
The new OpenPLC version now includes configuring communication settings, downloading ladder diagram programs, and executing structured debug sessions. From a product's perspective, the resulting automation systems are more reliable because logic behavior can be verified before deployment. Therefore, the transition to OpenPLC version 4.1.2 provides a clear improvement in industrial control system development.
Setup of the OpenPLC Debugger
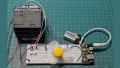
To utilize the debugger, the Arduino Uno PLC must be properly configured within the OpenPLC editor. The appropriate firmware is selected, and the communication port is assigned to establish a connection between the development machine and the controller. The Modbus RTU communication protocol is enabled, and a Slave ID is entered to support data exchange.
Once the ladder diagram is downloaded to the Arduino Uno PLC, a debug session is initiated by selecting the bug icon within the editor interface. During execution, the transmit and receive LEDs on the Arduino Uno will flash, indicating active communication between the controller and the OpenPLC editor. Figure 2 shows how to access the configuration settings panel for hardware device selection and communication setup.
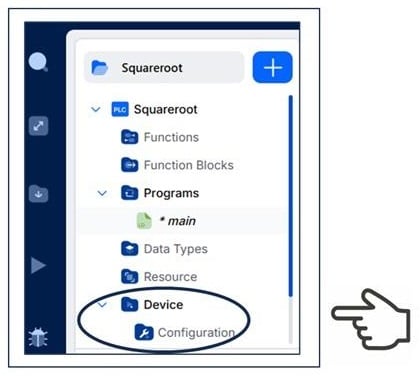
Figure 2. The Configuration Settings panel.
The selection of the Arduino Uno and the Modbus RTU communication setting is shown in Figure 3.
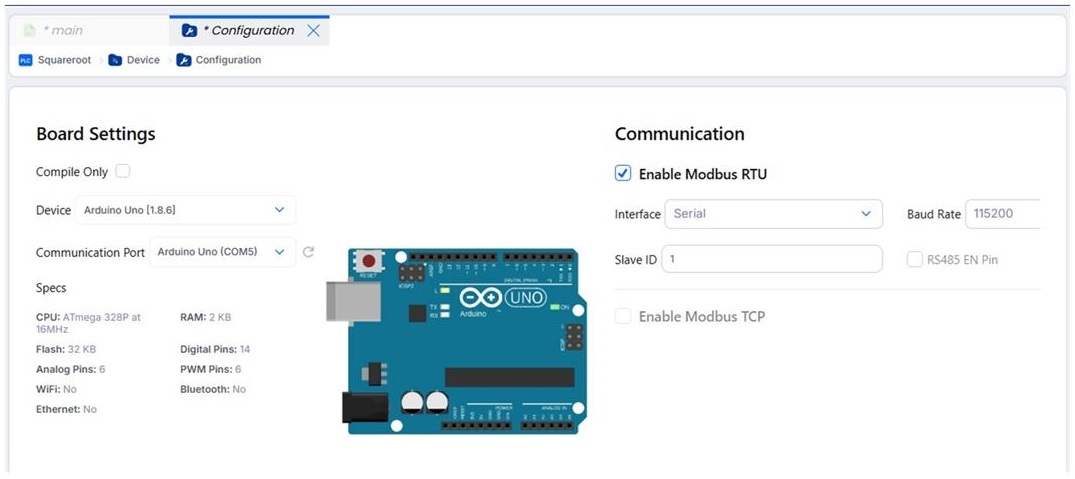
Figure 3. Configuring the Arduino Uno board and Modbus RTU communication.
Controls Engineers can identify logic errors, wiring issues, or incorrect configurations by monitoring variable states in real time. The ability to observe function block execution, such as mathematical and comparison operations, enhances system understanding. This reduces the need for repeated program modifications and shortens development time.
A Simple Debug Example
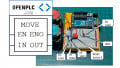
A basic AND logic gate can be used to illustrate the operation of the debugger in OpenPLC version 4.1.2. The ladder diagram consists of two input devices, PB1_Switch and PB2_Switch, connected in series using Examine If Closed (XIC) instructions. An Output Energize (OTE) instruction is used to control an LED based on the input conditions.
The LED will only turn on when both input devices are activated. The simple logic structure of the AND logic gate ladder diagram (LD) and tag listing provides a clear example of real-time monitoring.
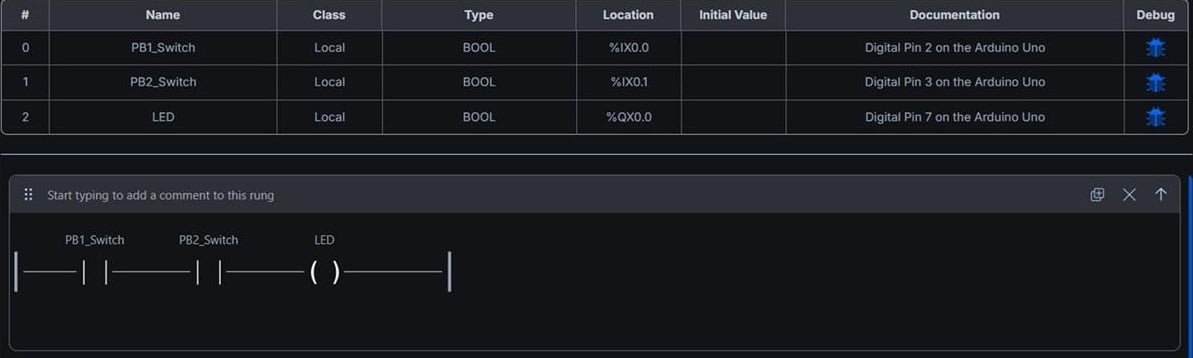
Figure 4. AND logic LD and tag listing.
To implement this example, the watch window is configured to display the status of PB1_Switch, PB2_Switch, and the LED output. Figure 5 illustrates the location of the OpenPLC bug icon.
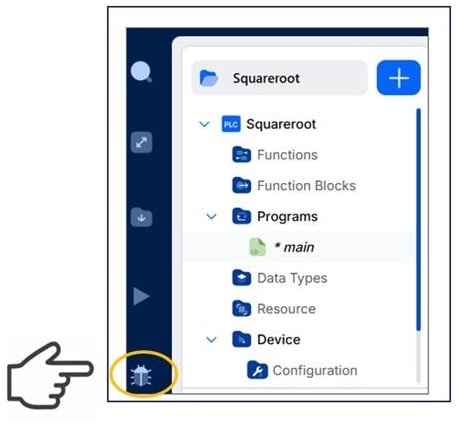
Figure 5. OpenPLC bug icon.
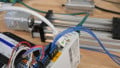
The debugger allows the logical behavior of the AND gate to be observed in real time. When both input devices are in the FALSE state, the LED remains OFF. When only one input device is activated, the LED remains OFF because the AND condition is not satisfied. When both PB1_Switch and PB2_Switch are activated, the LED changes to the ON state. This behavior is displayed immediately in the watch window, confirming correct logic operation.
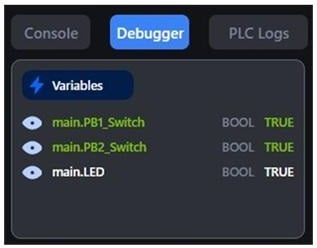
Figure 6. Watch window.
Figure 7 illustrates the input and output (I/O) monitoring of the pushbutton switches and the LED.
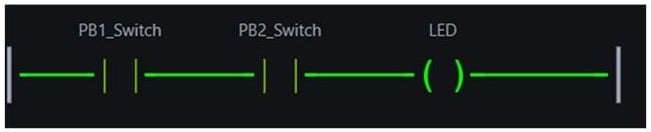
Figure 7. Monitoring the AND logic gate I/O.
As illustrated in this example, the debugger allows the Controls Engineer to observe how input conditions and the output respond to various applied Boolean events. The same real-time monitoring principles can be applied to complex ladder diagram applications. Therefore, the debugger provides a consistent method for validating control logic across different system designs and machinery applications.
All images used courtesy of the author